AI Dashboard is available on the Web, Apple, Google, and Microsoft, PRO version
What are the Top 200 AWS and Google Certified Machine Learning Specialty Questions and Answers Dumps?
This blog is the best way is the best way to prepare for your upcoming AWS Certified Machine Learning Specialty and Google Certified Professional Machine Learning Engineer exam. With over 100 questions and answers, this blog provides quizzes similar that are very similar to the real exam. It also includes the option to show and hide answers. Additionally, there are machine learning interview questions and detailed answers, as well as cheat sheets and illustrations. This blog is the best way to make sure you are well-prepared for your AWS Certified Machine Learning Specialty Exam.

The typical Google Machine Learning Engineer salary is $147,218. Machine Learning Engineer salaries at Google can range from $110,000 – $152,183.
Machine learning is an application of artificial intelligence (AI) that provides systems the ability to automatically learn and improve from experience without being explicitly programmed. Machine learning focuses on the development of computer programs that can access data and use it to learn for themselves.
- By the end of 2020, 85% of customer interactions will be handled without a human (Call Center, Chatbot, etc…)
- 61% of marketers say artificial intelligence is the most important aspect of their data strategy.
- 80% of business and tech leaders say AI already boosts productivity (Robotic Process Automation, Power Automate, etc..)
- Current AI technology can boost business productivity by up to 40%
AWS Machine Learning Certification Specialty Exam Prep for iOs Android Windows10/11

GCP Professional Machine Learning Engineer for iOs, Android, Windows 10/11
Quizzes, Practice Exams: Framing, Architecting, Designing, Developing ML Problems & Solutions, ML Jobs Interview Q&A

Get 20% off Google Google Workspace (Google Meet) Standard Plan with the following codes: 96DRHDRA9J7GTN6
 Get 20% off Google Workspace (Google Meet) Business Plan (AMERICAS): M9HNXHX3WC9H7YE (Email us for more codes)
Active Anti-Aging Eye Gel, Reduces Dark Circles, Puffy Eyes, Crow's Feet and Fine Lines & Wrinkles, Packed with Hyaluronic Acid & Age Defying Botanicals

Azure AI Fundamentals AI-900 Exam Prep App for iOS, Android, Windows10/11
Basics and Advanced Machine Learning Quizzes on Azure, Azure Machine Learning Job Interviews Questions and Answer, ML Cheat Sheets

Machine Learning For Dummies App for iOs, Android, Windows10/11
Use this App to learn about Machine Learning and Elevate your Brain with Machine Learning Quizzes, Cheat Sheets, Ml Jobs Interview Questions and Answers updated daily.


What does a Professional Machine Learning Engineer do?
A Professional Machine Learning Engineer designs, builds, and productionizes ML models to solve business challenges using Google Cloud technologies and knowledge of proven ML models and techniques. The ML Engineer collaborates closely with other job roles to ensure long-term success of models. The ML Engineer should be proficient in all aspects of model architecture, data pipeline interaction, and metrics interpretation. The ML Engineer needs familiarity with application development, infrastructure management, data engineering, and security. Through an understanding of training, retraining, deploying, scheduling, monitoring, and improving models, they design and create scalable solutions for optimal performance.

The AWS Certified Machine Learning – Specialty certification is intended for individuals who perform a development or data science role. It validates a candidate’s ability to design, implement, deploy, and maintain machine learning (ML) solutions for given business problems.
This blog covers Machine Learning 101, Top 20 AWS Certified Machine Learning Specialty Questions and Answers, Top 20 Google Professional Machine Learning Engineer Sample Questions, Machine Learning Quizzes, Machine Learning Q&A, Top 10 Machine Learning Algorithms, Machine Learning Latest Hot News, Machine Learning Demos (Ex: Tensorflow Demos)
Below are the Top 100 AWS Certified Machine Learning Specialty Questions and Answers Dumps.
Question1: A machine learning team has several large CSV datasets in Amazon S3. Historically, models built with the Amazon SageMaker Linear Learner algorithm have taken hours to train on similar-sized datasets. The team’s leaders need to accelerate the training process. What can a machine learning specialist do to address this concern?
A) Use Amazon SageMaker Pipe mode.
B) Use Amazon Machine Learning to train the models.
C) Use Amazon Kinesis to stream the data to Amazon SageMaker.
D) Use AWS Glue to transform the CSV dataset to the JSON format.
ANSWER1:
Notes/Hint1:


Question 2) A local university wants to track cars in a parking lot to determine which students are parking in the lot. The university is wanting to ingest videos of the cars parking in near-real time, use machine learning to identify license plates, and store that data in an AWS data store. Which solution meets these requirements with the LEAST amount of development effort?
A) Use Amazon Kinesis Data Streams to ingest the video in near-real time, use the Kinesis Data Streams consumer integrated with Amazon Rekognition Video to process the license plate information, and then store results in DynamoDB.
B) Use Amazon Kinesis Video Streams to ingest the videos in near-real time, use the Kinesis Video Streams integration with Amazon Rekognition Video to identify the license plate information, and then store the results in DynamoDB.
C) Use Amazon Kinesis Data Streams to ingest videos in near-real time, call Amazon Rekognition to identify license plate information, and then store results in DynamoDB.

D) Use Amazon Kinesis Firehose to ingest the video in near-real time and outputs results onto S3. Set up a Lambda function that triggers when a new video is PUT onto S3 to send results to Amazon Rekognition to identify license plate information, and then store results in DynamoDB.
Answer 2)
Notes/Hint2)
Question 3) A term frequency–inverse document frequency (tf–idf) matrix using both unigrams and bigrams is built from a text corpus consisting of the following two sentences:
ANSWER3:
Notes/Hint3:
Question 4: A company is setting up a system to manage all of the datasets it stores in Amazon S3. The company would like to automate running transformation jobs on the data and maintaining a catalog of the metadata concerning the datasets. The solution should require the least amount of setup and maintenance. Which solution will allow the company to achieve its goals?
ANSWER4:
Notes/Hint4:
Unlock the Secrets of Africa: Master African History, Geography, Culture, People, Cuisine, Economics, Languages, Music, Wildlife, Football, Politics, Animals, Tourism, Science and Environment with the Top 1000 Africa Quiz and Trivia. Get Yours Now!
"Become a Canada Expert: Ace the Citizenship Test and Impress Everyone with Your Knowledge of Canadian History, Geography, Government, Culture, People, Languages, Travel, Wildlife, Hockey, Tourism, Sceneries, Arts, and Data Visualization. Get the Top 1000 Canada Quiz Now!"
Question 5) Which service in the Kinesis family allows you to easily load streaming data into data stores and analytics tools?
ANSWER5:
Notes/Hint5:
Notes 6)
Notes/Hint 8)

Answer 9)
Notes 9)
Answer 10)
Answer 11)
Notes 11)
Notes 12)
Answer 13)
Notes 13)
Question 14) You have been tasked with capturing two different types of streaming events. The first event type includes mission-critical data that needs to immediately be processed before operations can continue. The second event type includes data of less importance, but operations can continue without immediately processing. What is the most appropriate solution to record these different types of events?
Answer 14)
Notes 14)
Question 15) You are collecting clickstream data from an e-commerce website to make near-real time product suggestions for users actively using the site. Which combination of tools can be used to achieve the quickest recommendations and meets all of the requirements?
Answer 15)
Notes 15)
Question 16) Which service built by AWS makes it easy to set up a retry mechanism, aggregate records to improve throughput, and automatically submits CloudWatch metrics?
Answer 16)
Notes 16)
[appbox appstore 1611045854-iphone screenshots]
[appbox microsoftstore 9n8rl80hvm4t-mobile screenshots]
Question 17) You have been tasked with capturing data from an online gaming platform to run analytics on and process through a machine learning pipeline. The data that you are ingesting is players controller inputs every 1 second (up to 10 players in a game) that is in JSON format. The data needs to be ingested through Kinesis Data Streams and the JSON data blob is 100 KB in size. What is the minimum number of shards you can use to successfully ingest this data?
Answer 17)
Notes 17)
Question 18) Which services in the Kinesis family allows you to analyze streaming data, gain actionable insights, and respond to your business and customer needs in real time?
Answer 18)
Notes 18)
Question 19) You are a ML specialist needing to collect data from Twitter tweets. Your goal is to collect tweets that include only the name of your company and the tweet body, and store it off into a data store in AWS. What set of tools can you use to stream, transform, and load the data into AWS with the LEAST amount of effort?
Answer 19)
Notes 19)
Question 20) Which service in the Kinesis family allows you to build custom applications that process or analyze streaming data for specialized needs?
Answer 20)
Notes 20)
Question21:
Answer21:
What are the Top 100 AWS and Google Certified Machine Learning Specialty Questions and Answers Dumps?
This blog is the best way is the best way to prepare for your upcoming AWS Certified Machine Learning Specialty and Google Certified Professional Machine Learning Engineer exam. With over 100 questions and answers, this blog provides quizzes similar that are very similar to the real exam. It also includes the option to show and hide answers. Additionally, there are machine learning interview questions and detailed answers, as well as cheat sheets and illustrations. This blog is the best way to make sure you are well-prepared for your AWS Certified Machine Learning Specialty Exam.
The typical Google Machine Learning Engineer salary is $147,218. Machine Learning Engineer salaries at Google can range from $110,000 – $152,183.
Machine learning is an application of artificial intelligence (AI) that provides systems the ability to automatically learn and improve from experience without being explicitly programmed. Machine learning focuses on the development of computer programs that can access data and use it to learn for themselves.
- By the end of 2020, 85% of customer interactions will be handled without a human (Call Center, Chatbot, etc…)
- 61% of marketers say artificial intelligence is the most important aspect of their data strategy.
- 80% of business and tech leaders say AI already boosts productivity (Robotic Process Automation, Power Automate, etc..)
- Current AI technology can boost business productivity by up to 40%
AWS Machine Learning Certification Specialty Exam Prep for iOs Android Windows10/11
GCP Professional Machine Learning Engineer for iOs, Android, Windows 10/11
Quizzes, Practice Exams: Framing, Architecting, Designing, Developing ML Problems & Solutions, ML Jobs Interview Q&A
Azure AI Fundamentals AI-900 Exam Prep App for iOS, Android, Windows10/11
Basics and Advanced Machine Learning Quizzes on Azure, Azure Machine Learning Job Interviews Questions and Answer, ML Cheat Sheets
Machine Learning For Dummies App for iOs, Android, Windows10/11
Use this App to learn about Machine Learning and Elevate your Brain with Machine Learning Quizzes, Cheat Sheets, Ml Jobs Interview Questions and Answers updated daily.
What does a Professional Machine Learning Engineer do?
A Professional Machine Learning Engineer designs, builds, and productionizes ML models to solve business challenges using Google Cloud technologies and knowledge of proven ML models and techniques. The ML Engineer collaborates closely with other job roles to ensure long-term success of models. The ML Engineer should be proficient in all aspects of model architecture, data pipeline interaction, and metrics interpretation. The ML Engineer needs familiarity with application development, infrastructure management, data engineering, and security. Through an understanding of training, retraining, deploying, scheduling, monitoring, and improving models, they design and create scalable solutions for optimal performance.
The AWS Certified Machine Learning – Specialty certification is intended for individuals who perform a development or data science role. It validates a candidate’s ability to design, implement, deploy, and maintain machine learning (ML) solutions for given business problems.
This blog covers Machine Learning 101, Top 20 AWS Certified Machine Learning Specialty Questions and Answers, Top 20 Google Professional Machine Learning Engineer Sample Questions, Machine Learning Quizzes, Machine Learning Q&A, Top 10 Machine Learning Algorithms, Machine Learning Latest Hot News, Machine Learning Demos (Ex: Tensorflow Demos)
Question1: A machine learning team has several large CSV datasets in Amazon S3. Historically, models built with the Amazon SageMaker Linear Learner algorithm have taken hours to train on similar-sized datasets. The team’s leaders need to accelerate the training process. What can a machine learning specialist do to address this concern?
A) Use Amazon SageMaker Pipe mode.
B) Use Amazon Machine Learning to train the models.
C) Use Amazon Kinesis to stream the data to Amazon SageMaker.
D) Use AWS Glue to transform the CSV dataset to the JSON format.
ANSWER1:
Notes/Hint1:
Question 2) A local university wants to track cars in a parking lot to determine which students are parking in the lot. The university is wanting to ingest videos of the cars parking in near-real time, use machine learning to identify license plates, and store that data in an AWS data store. Which solution meets these requirements with the LEAST amount of development effort?
A) Use Amazon Kinesis Data Streams to ingest the video in near-real time, use the Kinesis Data Streams consumer integrated with Amazon Rekognition Video to process the license plate information, and then store results in DynamoDB.
B) Use Amazon Kinesis Video Streams to ingest the videos in near-real time, use the Kinesis Video Streams integration with Amazon Rekognition Video to identify the license plate information, and then store the results in DynamoDB.
C) Use Amazon Kinesis Data Streams to ingest videos in near-real time, call Amazon Rekognition to identify license plate information, and then store results in DynamoDB.
D) Use Amazon Kinesis Firehose to ingest the video in near-real time and outputs results onto S3. Set up a Lambda function that triggers when a new video is PUT onto S3 to send results to Amazon Rekognition to identify license plate information, and then store results in DynamoDB.
Answer 2)
Notes/Hint2)
Question 3) A term frequency–inverse document frequency (tf–idf) matrix using both unigrams and bigrams is built from a text corpus consisting of the following two sentences:
ANSWER3:
Notes/Hint3:
Question 4: A company is setting up a system to manage all of the datasets it stores in Amazon S3. The company would like to automate running transformation jobs on the data and maintaining a catalog of the metadata concerning the datasets. The solution should require the least amount of setup and maintenance. Which solution will allow the company to achieve its goals?
ANSWER4:
Notes/Hint4:
Question 5) Which service in the Kinesis family allows you to easily load streaming data into data stores and analytics tools?
ANSWER5:
Notes/Hint5:
Notes 6)
Notes/Hint 8)
Answer 9)
Notes 9)
Answer 10)
Answer 11)
Notes 11)
Notes 12)
Answer 13)
Notes 13)
Question 14) You have been tasked with capturing two different types of streaming events. The first event type includes mission-critical data that needs to immediately be processed before operations can continue. The second event type includes data of less importance, but operations can continue without immediately processing. What is the most appropriate solution to record these different types of events?
Answer 14)
Notes 14)
Question 15) You are collecting clickstream data from an e-commerce website to make near-real time product suggestions for users actively using the site. Which combination of tools can be used to achieve the quickest recommendations and meets all of the requirements?
Answer 15)
Notes 15)
Question 16) Which service built by AWS makes it easy to set up a retry mechanism, aggregate records to improve throughput, and automatically submits CloudWatch metrics?
Answer 16)
Notes 16)
[appbox appstore 1611045854-iphone screenshots]
[appbox microsoftstore 9n8rl80hvm4t-mobile screenshots]
Question 17) You have been tasked with capturing data from an online gaming platform to run analytics on and process through a machine learning pipeline. The data that you are ingesting is players controller inputs every 1 second (up to 10 players in a game) that is in JSON format. The data needs to be ingested through Kinesis Data Streams and the JSON data blob is 100 KB in size. What is the minimum number of shards you can use to successfully ingest this data?
Answer 17)
Notes 17)
Question 18) Which services in the Kinesis family allows you to analyze streaming data, gain actionable insights, and respond to your business and customer needs in real time?
Answer 18)
Notes 18)
Question 19) You are a ML specialist needing to collect data from Twitter tweets. Your goal is to collect tweets that include only the name of your company and the tweet body, and store it off into a data store in AWS. What set of tools can you use to stream, transform, and load the data into AWS with the LEAST amount of effort?
Answer 19)
Notes 19)
Question 20) Which service in the Kinesis family allows you to build custom applications that process or analyze streaming data for specialized needs?
Answer 20)
Notes 20)
Question21:
Answer21:
Notes 21:
Question22:
Answer22:
Notes 22:
Question23:
Answer23:
Notes 23:
Question24:
Answer24:
Notes 24:
What are the Top 100 AWS and Google Certified Machine Learning Specialty Questions and Answers Dumps?
This blog is the best way is the best way to prepare for your upcoming AWS Certified Machine Learning Specialty and Google Certified Professional Machine Learning Engineer exam. With over 100 questions and answers, this blog provides quizzes similar that are very similar to the real exam. It also includes the option to show and hide answers. Additionally, there are machine learning interview questions and detailed answers, as well as cheat sheets and illustrations. This blog is the best way to make sure you are well-prepared for your AWS Certified Machine Learning Specialty Exam.
The typical Google Machine Learning Engineer salary is $147,218. Machine Learning Engineer salaries at Google can range from $110,000 – $152,183.
Machine learning is an application of artificial intelligence (AI) that provides systems the ability to automatically learn and improve from experience without being explicitly programmed. Machine learning focuses on the development of computer programs that can access data and use it to learn for themselves.
- By the end of 2020, 85% of customer interactions will be handled without a human (Call Center, Chatbot, etc…)
- 61% of marketers say artificial intelligence is the most important aspect of their data strategy.
- 80% of business and tech leaders say AI already boosts productivity (Robotic Process Automation, Power Automate, etc..)
- Current AI technology can boost business productivity by up to 40%
AWS Machine Learning Certification Specialty Exam Prep for iOs Android Windows10/11
GCP Professional Machine Learning Engineer for iOs, Android, Windows 10/11
Quizzes, Practice Exams: Framing, Architecting, Designing, Developing ML Problems & Solutions, ML Jobs Interview Q&A
Azure AI Fundamentals AI-900 Exam Prep App for iOS, Android, Windows10/11
Basics and Advanced Machine Learning Quizzes on Azure, Azure Machine Learning Job Interviews Questions and Answer, ML Cheat Sheets
Machine Learning For Dummies App for iOs, Android, Windows10/11
Use this App to learn about Machine Learning and Elevate your Brain with Machine Learning Quizzes, Cheat Sheets, Ml Jobs Interview Questions and Answers updated daily.
What does a Professional Machine Learning Engineer do?
A Professional Machine Learning Engineer designs, builds, and productionizes ML models to solve business challenges using Google Cloud technologies and knowledge of proven ML models and techniques. The ML Engineer collaborates closely with other job roles to ensure long-term success of models. The ML Engineer should be proficient in all aspects of model architecture, data pipeline interaction, and metrics interpretation. The ML Engineer needs familiarity with application development, infrastructure management, data engineering, and security. Through an understanding of training, retraining, deploying, scheduling, monitoring, and improving models, they design and create scalable solutions for optimal performance.
The AWS Certified Machine Learning – Specialty certification is intended for individuals who perform a development or data science role. It validates a candidate’s ability to design, implement, deploy, and maintain machine learning (ML) solutions for given business problems.
This blog covers Machine Learning 101, Top 20 AWS Certified Machine Learning Specialty Questions and Answers, Top 20 Google Professional Machine Learning Engineer Sample Questions, Machine Learning Quizzes, Machine Learning Q&A, Top 10 Machine Learning Algorithms, Machine Learning Latest Hot News, Machine Learning Demos (Ex: Tensorflow Demos)
Question1: A machine learning team has several large CSV datasets in Amazon S3. Historically, models built with the Amazon SageMaker Linear Learner algorithm have taken hours to train on similar-sized datasets. The team’s leaders need to accelerate the training process. What can a machine learning specialist do to address this concern?
A) Use Amazon SageMaker Pipe mode.
B) Use Amazon Machine Learning to train the models.
C) Use Amazon Kinesis to stream the data to Amazon SageMaker.
D) Use AWS Glue to transform the CSV dataset to the JSON format.
ANSWER1:
Notes/Hint1:
Question 2) A local university wants to track cars in a parking lot to determine which students are parking in the lot. The university is wanting to ingest videos of the cars parking in near-real time, use machine learning to identify license plates, and store that data in an AWS data store. Which solution meets these requirements with the LEAST amount of development effort?
A) Use Amazon Kinesis Data Streams to ingest the video in near-real time, use the Kinesis Data Streams consumer integrated with Amazon Rekognition Video to process the license plate information, and then store results in DynamoDB.
B) Use Amazon Kinesis Video Streams to ingest the videos in near-real time, use the Kinesis Video Streams integration with Amazon Rekognition Video to identify the license plate information, and then store the results in DynamoDB.
C) Use Amazon Kinesis Data Streams to ingest videos in near-real time, call Amazon Rekognition to identify license plate information, and then store results in DynamoDB.
D) Use Amazon Kinesis Firehose to ingest the video in near-real time and outputs results onto S3. Set up a Lambda function that triggers when a new video is PUT onto S3 to send results to Amazon Rekognition to identify license plate information, and then store results in DynamoDB.
Answer 2)
Notes/Hint2)
Question 3) A term frequency–inverse document frequency (tf–idf) matrix using both unigrams and bigrams is built from a text corpus consisting of the following two sentences:
ANSWER3:
Notes/Hint3:
Question 4: A company is setting up a system to manage all of the datasets it stores in Amazon S3. The company would like to automate running transformation jobs on the data and maintaining a catalog of the metadata concerning the datasets. The solution should require the least amount of setup and maintenance. Which solution will allow the company to achieve its goals?
ANSWER4:
Notes/Hint4:
Question 5) Which service in the Kinesis family allows you to easily load streaming data into data stores and analytics tools?
ANSWER5:
Notes/Hint5:
Notes 6)
Notes/Hint 8)
Answer 9)
Notes 9)
Answer 10)
Answer 11)
Notes 11)
Notes 12)
Answer 13)
Notes 13)
Question 14) You have been tasked with capturing two different types of streaming events. The first event type includes mission-critical data that needs to immediately be processed before operations can continue. The second event type includes data of less importance, but operations can continue without immediately processing. What is the most appropriate solution to record these different types of events?
Answer 14)
Notes 14)
Question 15) You are collecting clickstream data from an e-commerce website to make near-real time product suggestions for users actively using the site. Which combination of tools can be used to achieve the quickest recommendations and meets all of the requirements?
Answer 15)
Notes 15)
Question 16) Which service built by AWS makes it easy to set up a retry mechanism, aggregate records to improve throughput, and automatically submits CloudWatch metrics?
Answer 16)
Notes 16)
[appbox appstore 1611045854-iphone screenshots]
[appbox microsoftstore 9n8rl80hvm4t-mobile screenshots]
Question 17) You have been tasked with capturing data from an online gaming platform to run analytics on and process through a machine learning pipeline. The data that you are ingesting is players controller inputs every 1 second (up to 10 players in a game) that is in JSON format. The data needs to be ingested through Kinesis Data Streams and the JSON data blob is 100 KB in size. What is the minimum number of shards you can use to successfully ingest this data?
Answer 17)
Notes 17)
Question 18) Which services in the Kinesis family allows you to analyze streaming data, gain actionable insights, and respond to your business and customer needs in real time?
Answer 18)
Notes 18)
Question 19) You are a ML specialist needing to collect data from Twitter tweets. Your goal is to collect tweets that include only the name of your company and the tweet body, and store it off into a data store in AWS. What set of tools can you use to stream, transform, and load the data into AWS with the LEAST amount of effort?
Answer 19)
Notes 19)
Question 20) Which service in the Kinesis family allows you to build custom applications that process or analyze streaming data for specialized needs?
Answer 20)
Notes 20)
Question21:
Answer21:
What are the Top 100 AWS and Google Certified Machine Learning Specialty Questions and Answers Dumps?
This blog is the best way is the best way to prepare for your upcoming AWS Certified Machine Learning Specialty and Google Certified Professional Machine Learning Engineer exam. With over 100 questions and answers, this blog provides quizzes similar that are very similar to the real exam. It also includes the option to show and hide answers. Additionally, there are machine learning interview questions and detailed answers, as well as cheat sheets and illustrations. This blog is the best way to make sure you are well-prepared for your AWS Certified Machine Learning Specialty Exam.
The typical Google Machine Learning Engineer salary is $147,218. Machine Learning Engineer salaries at Google can range from $110,000 – $152,183.
Machine learning is an application of artificial intelligence (AI) that provides systems the ability to automatically learn and improve from experience without being explicitly programmed. Machine learning focuses on the development of computer programs that can access data and use it to learn for themselves.
- By the end of 2020, 85% of customer interactions will be handled without a human (Call Center, Chatbot, etc…)
- 61% of marketers say artificial intelligence is the most important aspect of their data strategy.
- 80% of business and tech leaders say AI already boosts productivity (Robotic Process Automation, Power Automate, etc..)
- Current AI technology can boost business productivity by up to 40%
AWS Machine Learning Certification Specialty Exam Prep for iOs Android Windows10/11
GCP Professional Machine Learning Engineer for iOs, Android, Windows 10/11
Quizzes, Practice Exams: Framing, Architecting, Designing, Developing ML Problems & Solutions, ML Jobs Interview Q&A
Azure AI Fundamentals AI-900 Exam Prep App for iOS, Android, Windows10/11
Basics and Advanced Machine Learning Quizzes on Azure, Azure Machine Learning Job Interviews Questions and Answer, ML Cheat Sheets
Machine Learning For Dummies App for iOs, Android, Windows10/11
Use this App to learn about Machine Learning and Elevate your Brain with Machine Learning Quizzes, Cheat Sheets, Ml Jobs Interview Questions and Answers updated daily.
What does a Professional Machine Learning Engineer do?
A Professional Machine Learning Engineer designs, builds, and productionizes ML models to solve business challenges using Google Cloud technologies and knowledge of proven ML models and techniques. The ML Engineer collaborates closely with other job roles to ensure long-term success of models. The ML Engineer should be proficient in all aspects of model architecture, data pipeline interaction, and metrics interpretation. The ML Engineer needs familiarity with application development, infrastructure management, data engineering, and security. Through an understanding of training, retraining, deploying, scheduling, monitoring, and improving models, they design and create scalable solutions for optimal performance.
The AWS Certified Machine Learning – Specialty certification is intended for individuals who perform a development or data science role. It validates a candidate’s ability to design, implement, deploy, and maintain machine learning (ML) solutions for given business problems.
This blog covers Machine Learning 101, Top 20 AWS Certified Machine Learning Specialty Questions and Answers, Top 20 Google Professional Machine Learning Engineer Sample Questions, Machine Learning Quizzes, Machine Learning Q&A, Top 10 Machine Learning Algorithms, Machine Learning Latest Hot News, Machine Learning Demos (Ex: Tensorflow Demos)
Question1: A machine learning team has several large CSV datasets in Amazon S3. Historically, models built with the Amazon SageMaker Linear Learner algorithm have taken hours to train on similar-sized datasets. The team’s leaders need to accelerate the training process. What can a machine learning specialist do to address this concern?
A) Use Amazon SageMaker Pipe mode.
B) Use Amazon Machine Learning to train the models.
C) Use Amazon Kinesis to stream the data to Amazon SageMaker.
D) Use AWS Glue to transform the CSV dataset to the JSON format.
ANSWER1:
Notes/Hint1:
Question 2) A local university wants to track cars in a parking lot to determine which students are parking in the lot. The university is wanting to ingest videos of the cars parking in near-real time, use machine learning to identify license plates, and store that data in an AWS data store. Which solution meets these requirements with the LEAST amount of development effort?
A) Use Amazon Kinesis Data Streams to ingest the video in near-real time, use the Kinesis Data Streams consumer integrated with Amazon Rekognition Video to process the license plate information, and then store results in DynamoDB.
B) Use Amazon Kinesis Video Streams to ingest the videos in near-real time, use the Kinesis Video Streams integration with Amazon Rekognition Video to identify the license plate information, and then store the results in DynamoDB.
C) Use Amazon Kinesis Data Streams to ingest videos in near-real time, call Amazon Rekognition to identify license plate information, and then store results in DynamoDB.
D) Use Amazon Kinesis Firehose to ingest the video in near-real time and outputs results onto S3. Set up a Lambda function that triggers when a new video is PUT onto S3 to send results to Amazon Rekognition to identify license plate information, and then store results in DynamoDB.
Answer 2)
Notes/Hint2)
Question 3) A term frequency–inverse document frequency (tf–idf) matrix using both unigrams and bigrams is built from a text corpus consisting of the following two sentences:
ANSWER3:
Notes/Hint3:
Question 4: A company is setting up a system to manage all of the datasets it stores in Amazon S3. The company would like to automate running transformation jobs on the data and maintaining a catalog of the metadata concerning the datasets. The solution should require the least amount of setup and maintenance. Which solution will allow the company to achieve its goals?
ANSWER4:
Notes/Hint4:
Question 5) Which service in the Kinesis family allows you to easily load streaming data into data stores and analytics tools?
ANSWER5:
Notes/Hint5:
Question 6) A data scientist is working on optimizing a model during the training process by varying multiple parameters. The data scientist observes that, during multiple runs with identical parameters, the loss function converges to different, yet stable, values. What should the data scientist do to improve the training process?
Notes 6)
Question 7) Your organization has a standalone Javascript (Node.js) application that streams data into AWS using Kinesis Data Streams. You notice that they are using the Kinesis API (AWS SDK) over the Kinesis Producer Library (KPL). What might be the reasoning behind this?
Question 8) A data scientist is evaluating different binary classification models. A false positive result is 5 times more expensive (from a business perspective) than a false negative result. The models should be evaluated based on the following criteria:
Notes/Hint 8)
Question 9) A data scientist uses logistic regression to build a fraud detection model. While the model accuracy is 99%, 90% of the fraud cases are not detected by the model. What action will definitely help the model detect more than 10% of fraud cases?
Answer 9)
Notes 9)
Question 10) A company is interested in building a fraud detection model. Currently, the data scientist does not have a sufficient amount of information due to the low number of fraud cases. Which method is MOST likely to detect the GREATEST number of valid fraud cases?
Answer 10)
Question 11) A machine learning engineer is preparing a data frame for a supervised learning task with the Amazon SageMaker Linear Learner algorithm. The ML engineer notices the target label classes are highly imbalanced and multiple feature columns contain missing values. The proportion of missing values across the entire data frame is less than 5%. What should the ML engineer do to minimize bias due to missing values?
Answer 11)
Notes 11)
Question 12) A company has collected customer comments on its products, rating them as safe or unsafe, using decision trees. The training dataset has the following features: id, date, full review, full review summary, and a binary safe/unsafe tag. During training, any data sample with missing features was dropped. In a few instances, the test set was found to be missing the full review text field. For this use case, which is the most effective course of action to address test data samples with missing features?
Notes 12)
Question 13) An insurance company needs to automate claim compliance reviews because human reviews are expensive and error-prone. The company has a large set of claims and a compliance label for each. Each claim consists of a few sentences in English, many of which contain complex related information. Management would like to use Amazon SageMaker built-in algorithms to design a machine learning supervised model that can be trained to read each claim and predict if the claim is compliant or not. Which approach should be used to extract features from the claims to be used as inputs for the downstream supervised task?
Answer 13)
Notes 13)
Question 14) You have been tasked with capturing two different types of streaming events. The first event type includes mission-critical data that needs to immediately be processed before operations can continue. The second event type includes data of less importance, but operations can continue without immediately processing. What is the most appropriate solution to record these different types of events?
Answer 14)
Notes 14)
Question 15) You are collecting clickstream data from an e-commerce website to make near-real time product suggestions for users actively using the site. Which combination of tools can be used to achieve the quickest recommendations and meets all of the requirements?
Answer 15)
Notes 15)
Question 16) Which service built by AWS makes it easy to set up a retry mechanism, aggregate records to improve throughput, and automatically submits CloudWatch metrics?
Answer 16)
Notes 16)
[appbox appstore 1611045854-iphone screenshots]
[appbox microsoftstore 9n8rl80hvm4t-mobile screenshots]
Question 17) You have been tasked with capturing data from an online gaming platform to run analytics on and process through a machine learning pipeline. The data that you are ingesting is players controller inputs every 1 second (up to 10 players in a game) that is in JSON format. The data needs to be ingested through Kinesis Data Streams and the JSON data blob is 100 KB in size. What is the minimum number of shards you can use to successfully ingest this data?
Answer 17)
Notes 17)
Question 18) Which services in the Kinesis family allows you to analyze streaming data, gain actionable insights, and respond to your business and customer needs in real time?
Answer 18)
Notes 18)
Question 19) You are a ML specialist needing to collect data from Twitter tweets. Your goal is to collect tweets that include only the name of your company and the tweet body, and store it off into a data store in AWS. What set of tools can you use to stream, transform, and load the data into AWS with the LEAST amount of effort?
Answer 19)
Notes 19)
Question 20) Which service in the Kinesis family allows you to build custom applications that process or analyze streaming data for specialized needs?
Answer 20)
Notes 20)
Question21: Of the following, which is an example of machine learning? (Select TWO.)
A) Calculating the shortest route from current location to the destination
B) Optimizing product pricing based on real-time sales data
C) Sentiment analysis of text on product reviews
D) A loan approval system that classifies applicants entirely based on credit score
Answer21:
Notes 21:
Question22:Which of the following is an appropriate use case for unsupervised learning?
A) Partitioning an image of a street scene into multiple segments
B) Finding an optimal path out of a maze
C) Identifying clusters of housing sales based on related data points
D) Analyzing sentiment of social media posts
Answer22:
Notes 22:
Question23:
Answer23:
Notes 23:
Question24: A Djamgatech retail company wants to deploy a machine learning model to predict the demand for a product using sales data from the past 5 years. What is the MOST efficient solution that the company should implement first?
A) Regression
B) Multi-class classification
C) Binary class classification
D) N/A
Answer24:
Notes 24:
Question25: In which phase of the ML pipeline do you analyze the business requirements and re-frame that information into a machine learning context.
A) Problem formulation
B) Model training
C) Deployment
D)
Answer25:
Notes 25:
iOs: https://apps.apple.com/
Android/Amazon: https://www.amazon.com/gp/product/B09TZ4H8V6
AWS MLS-C01 Machine Learning Exam Prep
Quizzes, Practice Exams: Modeling, Data Engineering, Vision, Exploratory Data Analysis, ML Ops, Cheat Sheets, ML Jobs Interview Q&A
Use this App to learn about Machine Learning on AWS and prepare for the AWS Machine Learning Specialty Certification MLS-C01.
Earning AWS Certified Machine Learning Specialty validates expertise in building, training, tuning, and deploying machine learning (ML) models on AWS.
The App provides hundreds of quizzes and practice exam about:
– Machine Learning Operation on AWS
– Modelling
– Data Engineering
– Computer Vision,
– Exploratory Data Analysis,
– ML implementation & Operations
– Machine Learning Basics Questions and Answers
– Machine Learning Advanced Questions and Answers
– Scorecard
– Countdown timer
– Machine Learning Cheat Sheets
– Machine Learning Interview Questions and Answers
– Machine Learning Latest News
The App covers Machine Learning Basics and Advanced topics including: NLP, Computer Vision, Python, linear regression, logistic regression, Sampling, dataset, statistical interaction, selection bias, non-Gaussian distribution, bias-variance trade-off, Normal Distribution, correlation and covariance, Point Estimates and Confidence Interval, A/B Testing, p-value, statistical power of sensitivity, over-fitting and under-fitting, regularization, Law of Large Numbers, Confounding Variables, Survivorship Bias, univariate, bivariate and multivariate, Resampling, ROC curve, TF/IDF vectorization, Cluster Sampling, etc.
Domain 1: Data Engineering
Create data repositories for machine learning.
Identify data sources (e.g., content and location, primary sources such as user data)
Determine storage mediums (e.g., DB, Data Lake, S3, EFS, EBS)
Identify and implement a data ingestion solution.
Data job styles/types (batch load, streaming)
Data ingestion pipelines (Batch-based ML workloads and streaming-based ML workloads), etc.
Domain 2: Exploratory Data Analysis
Sanitize and prepare data for modeling.
Perform feature engineering.
Analyze and visualize data for machine learning.
Domain 3: Modeling
Frame business problems as machine learning problems.
Select the appropriate model(s) for a given machine learning problem.
Train machine learning models.
Perform hyperparameter optimization.
Evaluate machine learning models.
Domain 4: Machine Learning Implementation and Operations
Build machine learning solutions for performance, availability, scalability, resiliency, and fault tolerance.
Recommend and implement the appropriate machine learning services and features for a given problem.
Apply basic AWS security practices to machine learning solutions.
Deploy and operationalize machine learning solutions.
Machine Learning Services covered:
Amazon Comprehend
AWS Deep Learning AMIs (DLAMI)
AWS DeepLens
Amazon Forecast
Amazon Fraud Detector
Amazon Lex
Amazon Polly
Amazon Rekognition
Amazon SageMaker
Amazon Textract
Amazon Transcribe
Amazon Translate
Other Services and topics covered are:
Ingestion/Collection
Processing/ETL
Data analysis/visualization
Model training
Model deployment/inference
Operational
AWS ML application services
Language relevant to ML (for example, Python, Java, Scala, R, SQL)
Notebooks and integrated development environments (IDEs),
S3, SageMaker, Kinesis, Lake Formation, Athena, Kibana, Redshift, Textract, EMR, Glue, SageMaker, CSV, JSON, IMG, parquet or databases, Amazon Athena
Amazon EC2, Amazon Elastic Container Registry (Amazon ECR), Amazon Elastic Container Service, Amazon Elastic Kubernetes Service , Amazon Redshift
Sagemaker API Explained:

AWS Certified Machine Learning Engineer Specialty Questions and Answers:
Question1: An advertising and analytics company uses machine learning to predict user response to online advertisements using a custom XGBoost model. The company wants to improve its ML pipeline by porting its training and inference code, written in R, to Amazon SageMaker, and do so with minimal changes to the existing code.
Answer1: Use the Build Your Own Container (BYOC) Amazon Sagemaker option.
Create a new docker container with the existing code. Register the container in Amazon Elastic Container registry. with the existing code. Register the container in Amazon Elastic Container Registry. Finally run the training and inference jobs using this container.
Question2: Which feature of Amazon SageMaker can you use for preprocessing the data?
Answer2: Amazon Sagemaker Notebook instances
Amazon SageMaker enables developers and data scientists to build, train, tune, and deploy machine learning (ML) models at scale. You can deploy trained ML models for real-time or batch predictions on unseen data, a process known as inference. However, in most cases, the raw input data must be preprocessed and can’t be used directly for making predictions. This is because most ML models expect the data in a predefined format, so the raw data needs to be first cleaned and formatted in order for the ML model to process the data. You can use the Amazon SageMaker built-in Scikit-learn library for preprocessing input data and then use the Amazon SageMaker built-in Linear Learner algorithm for predictions.
Question3: What setting, when creating an Amazon SageMaker notebook instance, can you use to install libraries and import data?
Answer3: LifeCycle Configuration
Question4: How to Choose the right Sagemaker built-in algorithm?


This is a general guide for choosing which algorithm to use depending on what business problem you have and what data you have.
Top 10 Google Professional Machine Learning Engineer Sample Questions
Question 1: You work for a textile manufacturer and have been asked to build a model to detect and classify fabric defects. You trained a machine learning model with high recall based on high resolution images taken at the end of the production line. You want quality control inspectors to gain trust in your model. Which technique should you use to understand the rationale of your classifier?
A. Use K-fold cross validation to understand how the model performs on different test datasets.
B. Use the Integrated Gradients method to efficiently compute feature attributions for each predicted image.
C. Use PCA (Principal Component Analysis) to reduce the original feature set to a smaller set of easily understood features.
D. Use k-means clustering to group similar images together, and calculate the Davies-Bouldin index to evaluate the separation between clusters.
Answer 1)
Notes 1)
Question 2: You need to write a generic test to verify whether Dense Neural Network (DNN) models automatically released by your team have a sufficient number of parameters to learn the task for which they were built. What should you do?
Answer 2)
Notes 2)
[appbox appstore 1560083470-iphone screenshots]
[appbox googleplay com.awssolutionarchitectassociateexampreppro.app]
Answer 3)
Notes 3)
Question 4: You work on a team where the process for deploying a model into production starts with data scientists training different versions of models in a Kubeflow pipeline. The workflow then stores the new model artifact into the corresponding Cloud Storage bucket. You need to build the next steps of the pipeline after the submitted model is ready to be tested and deployed in production on AI Platform. How should you configure the architecture before deploying the model to production?
Question 10) You work for a large financial institution that is planning to use Dialogflow to create a chatbot for the company’s mobile app. You have reviewed old chat logs and tagged each conversation for intent based on each customer’s stated intention for contacting customer service. About 70% of customer inquiries are simple requests that are solved within 10 intents. The remaining 30% of inquiries require much longer and more complicated requests. Which intents should you automate first?
[appbox appstore 1611045854-iphone screenshots]
[appbox microsoftstore 9n8rl80hvm4t-mobile screenshots]
Machine Learning Q&A Part I:
Google.
Azure and AWS are second class citizens in this area.
Sure, AWS has 70% of the market.
Sure, Azure is the easiest turn key and super user friendly.
But, the king of machine learning in the cloud is GCP.
GCP = Google Cloud Platform
Google has the largest data science team in the world, not mention they have Hinton.
Let’s forgot for a minute they created TensorFlow and give it away.
Let’s just talk about building a real world model with data that doesn’t fit into a excel spreadsheet.
The vast majority of applied machine learning is supervised and that means we need data.
Not just normal data, we need very clean highly structured data.
Where’s the easiest place in the world to upload and model a Petabyte of structured data? BigQuery of course.
Why BigQuery? I don’t have to do anything but upload my data. No spinning up RedShit clusters or whatever I have to do in Azure, just upload and massage data with my familiar SQL. If I do have to wrangle my data it won’t take my six months to update 5 rows here, minutes usually.
Then, you’ll need a front end. Cloud datalab is a Jupyter notebook, which is good because I don’t want nor do I need anything else.
Then, with a single line of code I connect by datalab (Jupyter) notebook to my data in BigQuery and build away.
I’ve worked in all three and the only thing I care about is getting to my job the fastest and right now that means I build my models in GCP.
If you’re new to machine learning don’t start in GCP or any cloud vendor for that matter. Start learning Python from the comfort of your laptop.
The course below is free to the first 20.
The Complete Python Course for Machine Learning Engineers
Here, I want to share the best research paper on Machine Learning classification methods, titled ‘Do we Need Hundreds of Classifiers to Solve Real World Classification Problems?’, published in the ‘Journal of Machine Learning Research’.
This paper nicely explained 179 classification techniques and applied them on 121 data sets thus sharing small summary of the paper:
Do we Need Hundreds of Classifiers to Solve Real World Classification Problems?
The paper evaluated 179 classifiers arising from 17 ML families (discriminant analysis, Bayesian, neural networks, support vector machines, decision trees, rule-based classifiers, boosting, bagging, stacking, random forests and other ensembles, generalized linear models, nearest neighbours, partial least squares and principal component regression, logistic and multinomial regression, multiple adaptive regression splines and other methods), implemented in Weka, R ( with and without the caret package), C and Matlab, including all the relevant classifiers available today.
Experiments used total 121 data sets , which represent the whole UCI data base (excluding the large-scale problems) and other own real problems, in order to achieve significant conclusions about the classifier behaviour, not dependent on the data set collection.
The whole data set and partitions are available from: http://persoal.citius.usc.es/manuel.fernandez.delgado/papers/jmlr/data.tar.gz
The classifiers most likely to be the bests are the random forest (RF) versions, the best of which (implemented in R and accessed via caret) achieves 94.1% of the maximum accuracy overcoming 90% in the 84.3% of the data sets. However, the difference is not statistically significant with the second best, the SVM with Gaussian kernel implemented in C using LibSVM, which achieves 92.3% of the maximum accuracy. A few models are clearly better than the remaining ones: random forest, SVM with Gaussian and polynomial kernels, extreme learning machine with Gaussian kernel, C5.0 and avNNet (a committee of multi-layer perceptrons implemented in R with the caret package).
The random forest is clearly the best family of classifiers (3 out of 5 bests classifiers are RF), followed by SVM (4 classifiers in the top-10), neural networks and boosting ensembles (5 and 3 members in the top-20, respectively).
You can see the table with the complete results: http://persoal.citius.usc.es/manuel.fernandez.delgado/papers/jmlr/results.txt
I hope it will be helpful for Statistic and Machine Leaning aspirants!
Thank you!
These basic questions should help:
1. Is the classification going to be supervised or unsupervised? Several well defined techniques likes SVM (Support Vector Machines), trained neural net,etc. are applicable for supervised classification. For unsupervised classification, GMMs (Gaussian Mixture Models), HMMs (Hidden Markov models) with Baye’s techniques could be used. (Several other techniques could of course be used as well)
2.How much training data do you have in case it is supervised ? A small number of training data may yield discouraging classification accuracy even if the chosen classifier is the most suitable one for the problem. In such a case, try to obtain more number of samples. There’s also generally a correlation (for practical purposes at least) between the feature dimensionality and the number of samples for given technique. For example, while using SVM, the linear kernel tends to yield better results when the number of training samples are less than or equal to or only slightly more than the number of feature dimensions as compared to RBF or any other kernel.
3. If the feature vector dimensionality is small enough (1/2/3 -D) then it makes sense to plot and visually inspect if techniques like clustering could be more useful. With very high number of feature dimensions, methods like clustering are generally not advisable(Refer : “The Curse Of Dimensionality”).
4. Are you doing classification in real time ? Some techniques ,e.g. “Template Match” in image classification may lead to a higher number of errors but is generally faster than most other techniques if the number of templates to be evaluated are not excessively high.
5. Depending upon the problem domain, you can decide if you can choose the underlying model in such a way that it can use certain temporal/spatial correlations that may be inherent in the data. For example, HMMs use the temporal continuity of speech samples for enhancing classification results in speech recognition problems.
Another point, slightly off the topic perhaps, but the classification performance is as much a function of choosing the correct feature vectors, the pre-processing of the feature vectors as much as the classifier itself. It’s generally a good idea to give reserve some initial part of the project to try out various classifiers on the same data-set. It may at least help you reject the ones which are highly inaccurate.
At a high level, these skills are a combination of software and data engineering.
The persons that are more appropriate to do this job are a data engineer and/or a machine learning engineer.
That being said, if you work at a startup or happen to be in a small company and need to put the models into production yourself, here are the top skills you need to get:
- Well structured code: it doesn’t need to be perfect but at least can be understood and updated by other team members. Avoid spaghetti code[1] as the plague.
- Add logs: if you are a Python user, the logging[2] module is your friend. Avoid print statements at any cost.
- Model versioning: add a hash key to your different models. You will thank me later.
- Metadata everywhere: save as much data about your models and ML experiments as you can (running time, hyperparameters, used features, CV scores, and so on). You will thank me later, again.
- Monitor performances: execution time and statistical scores of your models.
- Data and models management: store the necessary data and models somewhere that is available to everyone (S3[3] for example). Avoid uploading these to your VCS[4] system. Don’t share them using Slack or Drive. I won’t judge you though, I do it sometimes (read often). Read more here …..
Some of the mistakes that might involve during building a machine learning model (I can think of) are listed here:
- Not understanding the structure of the dataset
- Not giving proper care during features selection
- Leaving out categorical features and considering just numerical variables
- Falling into dummy variable trap
- Selection of inefficient machine learning algorithm
- Not trying out various ML algorithms for building the model based on structure of data.
- Improper tuning of model parameters
- Most importantly: Building an idiotstic imperfect model i.e. suppose we have a classification problem with 99% chances of falling into class1 and remaining to class2. The built model may develop a mapping function which all the time for all data inputs, may predict the result to be class1. Well, one might say his/her model has 99% accuracy. But in reality the 1% class2 case hasn’t been included in the model. So this must be taken into consideration.
- Read more here…
[appbox appstore 1560083470-iphone screenshots]
[appbox googleplay com.awssolutionarchitectassociateexampreppro.app]
Basically, data mining is a key aspect of data analytics. Some even consider the former as essential to execute before the latter. While data analytics is the complete package and involves most components needed to examine a data set and extract valuable information, data mining focuses specifically on identifying hidden patterns.
That’s just the surface-level comparison though. The image above gives an overview of how the two differ.
One such difference is the presence of a hypothesis. Data analytics usually requires coming up with one, as it aims to find specific answers. Data mining, on the other hand, generally doesn’t need one to test or prove. The expected output are patterns or trends, which doesn’t require coming up with a statement or fact to test.
However, that doesn’t mean you mine data blindly. You still have a goal, whether it’s to come up with a recommender system or identify predictors of a certain dimension. Ultimately though, you strive to come up with data patterns or trends. For data analysis on the other hand, you’re expected to come up with valuable and actionable insights, usually in relation to a predetermined hypothesis. Read more here ….
The data science life cycle is not something well-defined like the software development life-cycle, and there is no ‘one-size-fits-all’ solution for data science projects. Every step in the life-cycle of a data science project depends on various data scientist skills and data science tools. The typical life-cycle of a data science project involves jumping back and forth among various interdependent science tasks using a variety of tools, techniques, programming, etc.
Thus, the data science life-cycle can include the following steps:
- Business requirement understanding.
- Data collection.
- Data cleaning.
- Data analysis.
- Modeling.
- Performance evaluation.
- Communicating with stakeholders.
- Deployment.
- Real-world testing.
- Business buy-in.
- Support and maintenance.
Looks neat, but here is the scheme to visualize how it is happening in reality:
Agile development processes, especially continuous delivery lends itself well to the data science project life-cycle. The early comparison helps the data science team to change approaches, refine hypotheses and even discard the project if the business case is nonviable or the benefits from the predictive models are not worth the effort to build it.
[appbox appstore 1611045854-iphone screenshots]
[appbox microsoftstore 9n8rl80hvm4t-mobile screenshots]
Machine Learning Q&A -Part II:
At a high level, these skills are a combination of software and data engineering.
The persons that are more appropriate to do this job are a data engineer and/or a machine learning engineer.
That being said, if you work at a startup or happen to be in a small company and need to put the models into production yourself, here are the top skills you need to get:
- Well structured code: it doesn’t need to be perfect but at least can be understood and updated by other team members. Avoid spaghetti code[1] as the plague.
- Add logs: if you are a Python user, the logging[2] module is your friend. Avoid print statements at any cost.
- Model versioning: add a hash key to your different models. You will thank me later.
- Metadata everywhere: save as much data about your models and ML experiments as you can (running time, hyperparameters, used features, CV scores, and so on). You will thank me later, again.
- Monitor performances: execution time and statistical scores of your models.
- Data and models management: store the necessary data and models somewhere that is available to everyone (S3[3] for example). Avoid uploading these to your VCS[4] system. Don’t share them using Slack or Drive. I won’t judge you though, I do it sometimes (read often). Read more here …..
Some of the mistakes that might involve during building a machine learning model (I can think of) are listed here:
- Not understanding the structure of the dataset
- Not giving proper care during features selection
- Leaving out categorical features and considering just numerical variables
- Falling into dummy variable trap
- Selection of inefficient machine learning algorithm
- Not trying out various ML algorithms for building the model based on structure of data.
- Improper tuning of model parameters
- Most importantly: Building an idiotstic imperfect model i.e. suppose we have a classification problem with 99% chances of falling into class1 and remaining to class2. The built model may develop a mapping function which all the time for all data inputs, may predict the result to be class1. Well, one might say his/her model has 99% accuracy. But in reality the 1% class2 case hasn’t been included in the model. So this must be taken into consideration.
- Read more here…
Basically, data mining is a key aspect of data analytics. Some even consider the former as essential to execute before the latter. While data analytics is the complete package and involves most components needed to examine a data set and extract valuable information, data mining focuses specifically on identifying hidden patterns.
That’s just the surface-level comparison though. The image above gives an overview of how the two differ.
One such difference is the presence of a hypothesis. Data analytics usually requires coming up with one, as it aims to find specific answers. Data mining, on the other hand, generally doesn’t need one to test or prove. The expected output are patterns or trends, which doesn’t require coming up with a statement or fact to test.
However, that doesn’t mean you mine data blindly. You still have a goal, whether it’s to come up with a recommender system or identify predictors of a certain dimension. Ultimately though, you strive to come up with data patterns or trends. For data analysis on the other hand, you’re expected to come up with valuable and actionable insights, usually in relation to a predetermined hypothesis. Read more here ….
The data science life cycle is not something well-defined like the software development life-cycle, and there is no ‘one-size-fits-all’ solution for data science projects. Every step in the life-cycle of a data science project depends on various data scientist skills and data science tools. The typical life-cycle of a data science project involves jumping back and forth among various interdependent science tasks using a variety of tools, techniques, programming, etc.
Thus, the data science life-cycle can include the following steps:
- Business requirement understanding.
- Data collection.
- Data cleaning.
- Data analysis.
- Modeling.
- Performance evaluation.
- Communicating with stakeholders.
- Deployment.
- Real-world testing.
- Business buy-in.
- Support and maintenance.
Looks neat, but here is the scheme to visualize how it is happening in reality:
Agile development processes, especially continuous delivery lends itself well to the data science project life-cycle. The early comparison helps the data science team to change approaches, refine hypotheses and even discard the project if the business case is nonviable or the benefits from the predictive models are not worth the effort to build it.
iOs: https://apps.apple.com/ca/app/aws-machine-learning-prep-pro/id1611045854
Android/Amazon: https://www.amazon.com/gp/product/B09TZ4H8V6
AWS MLS-C01 Machine Learning Exam Prep
Quizzes, Practice Exams: Modeling, Data Engineering, Vision, Exploratory Data Analysis, ML Ops, Cheat Sheets, ML Jobs Interview Q&A
Use this App to learn about Machine Learning on AWS and prepare for the AWS Machine Learning Specialty Certification MLS-C01.
Earning AWS Certified Machine Learning Specialty validates expertise in building, training, tuning, and deploying machine learning (ML) models on AWS.
The App provides hundreds of quizzes and practice exam about:
– Machine Learning Operation on AWS
– Modelling
– Data Engineering
– Computer Vision,
– Exploratory Data Analysis,
– ML implementation & Operations
– Machine Learning Basics Questions and Answers
– Machine Learning Advanced Questions and Answers
– Scorecard
– Countdown timer
– Machine Learning Cheat Sheets
– Machine Learning Interview Questions and Answers
– Machine Learning Latest News
The App covers Machine Learning Basics and Advanced topics including: NLP, Computer Vision, Python, linear regression, logistic regression, Sampling, dataset, statistical interaction, selection bias, non-Gaussian distribution, bias-variance trade-off, Normal Distribution, correlation and covariance, Point Estimates and Confidence Interval, A/B Testing, p-value, statistical power of sensitivity, over-fitting and under-fitting, regularization, Law of Large Numbers, Confounding Variables, Survivorship Bias, univariate, bivariate and multivariate, Resampling, ROC curve, TF/IDF vectorization, Cluster Sampling, etc.
Domain 1: Data Engineering
Create data repositories for machine learning.
Identify data sources (e.g., content and location, primary sources such as user data)
Determine storage mediums (e.g., DB, Data Lake, S3, EFS, EBS)
Identify and implement a data ingestion solution.
Data job styles/types (batch load, streaming)
Data ingestion pipelines (Batch-based ML workloads and streaming-based ML workloads), etc.
Domain 2: Exploratory Data Analysis
Sanitize and prepare data for modeling.
Perform feature engineering.
Analyze and visualize data for machine learning.
Domain 3: Modeling
Frame business problems as machine learning problems.
Select the appropriate model(s) for a given machine learning problem.
Train machine learning models.
Perform hyperparameter optimization.
Evaluate machine learning models.
Domain 4: Machine Learning Implementation and Operations
Build machine learning solutions for performance, availability, scalability, resiliency, and fault tolerance.
Recommend and implement the appropriate machine learning services and features for a given problem.
Apply basic AWS security practices to machine learning solutions.
Deploy and operationalize machine learning solutions.
Machine Learning Services covered:
Amazon Comprehend
AWS Deep Learning AMIs (DLAMI)
AWS DeepLens
Amazon Forecast
Amazon Fraud Detector
Amazon Lex
Amazon Polly
Amazon Rekognition
Amazon SageMaker
Amazon Textract
Amazon Transcribe
Amazon Translate
Other Services and topics covered are:
Ingestion/Collection
Processing/ETL
Data analysis/visualization
Model training
Model deployment/inference
Operational
AWS ML application services
Language relevant to ML (for example, Python, Java, Scala, R, SQL)
Notebooks and integrated development environments (IDEs),
S3, SageMaker, Kinesis, Lake Formation, Athena, Kibana, Redshift, Textract, EMR, Glue, SageMaker, CSV, JSON, IMG, parquet or databases, Amazon Athena
Amazon EC2, Amazon Elastic Container Registry (Amazon ECR), Amazon Elastic Container Service, Amazon Elastic Kubernetes Service , Amazon Redshift
Sagemaker API Explained:
AWS Certified Machine Learning Engineer Specialty Questions and Answers:
Question1: An advertising and analytics company uses machine learning to predict user response to online advertisements using a custom XGBoost model. The company wants to improve its ML pipeline by porting its training and inference code, written in R, to Amazon SageMaker, and do so with minimal changes to the existing code.
Answer1: Use the Build Your Own Container (BYOC) Amazon Sagemaker option.
Create a new docker container with the existing code. Register the container in Amazon Elastic Container registry. with the existing code. Register the container in Amazon Elastic Container Registry. Finally run the training and inference jobs using this container.
Question2: Which feature of Amazon SageMaker can you use for preprocessing the data?
Answer2: Amazon Sagemaker Notebook instances
Amazon SageMaker enables developers and data scientists to build, train, tune, and deploy machine learning (ML) models at scale. You can deploy trained ML models for real-time or batch predictions on unseen data, a process known as inference. However, in most cases, the raw input data must be preprocessed and can’t be used directly for making predictions. This is because most ML models expect the data in a predefined format, so the raw data needs to be first cleaned and formatted in order for the ML model to process the data. You can use the Amazon SageMaker built-in Scikit-learn library for preprocessing input data and then use the Amazon SageMaker built-in Linear Learner algorithm for predictions.
Question3: What setting, when creating an Amazon SageMaker notebook instance, can you use to install libraries and import data?
Answer3: LifeCycle Configuration
Question4: How to Choose the right Sagemaker built-in algorithm?
This is a general guide for choosing which algorithm to use depending on what business problem you have and what data you have.
Top 10 Google Professional Machine Learning Engineer Sample Questions
Question 1: You work for a textile manufacturer and have been asked to build a model to detect and classify fabric defects. You trained a machine learning model with high recall based on high resolution images taken at the end of the production line. You want quality control inspectors to gain trust in your model. Which technique should you use to understand the rationale of your classifier?
A. Use K-fold cross validation to understand how the model performs on different test datasets.
B. Use the Integrated Gradients method to efficiently compute feature attributions for each predicted image.
C. Use PCA (Principal Component Analysis) to reduce the original feature set to a smaller set of easily understood features.
D. Use k-means clustering to group similar images together, and calculate the Davies-Bouldin index to evaluate the separation between clusters.
Answer 1)
BNotes 1)
Question 2: You need to write a generic test to verify whether Dense Neural Network (DNN) models automatically released by your team have a sufficient number of parameters to learn the task for which they were built. What should you do?
Answer 2)
Notes 2)
[appbox appstore 1560083470-iphone screenshots]
[appbox googleplay com.awssolutionarchitectassociateexampreppro.app]
Answer 3)
Notes 3)
Question 4: You work on a team where the process for deploying a model into production starts with data scientists training different versions of models in a Kubeflow pipeline. The workflow then stores the new model artifact into the corresponding Cloud Storage bucket. You need to build the next steps of the pipeline after the submitted model is ready to be tested and deployed in production on AI Platform. How should you configure the architecture before deploying the model to production?
Question 10) You work for a large financial institution that is planning to use Dialogflow to create a chatbot for the company’s mobile app. You have reviewed old chat logs and tagged each conversation for intent based on each customer’s stated intention for contacting customer service. About 70% of customer inquiries are simple requests that are solved within 10 intents. The remaining 30% of inquiries require much longer and more complicated requests. Which intents should you automate first?
[appbox appstore 1611045854-iphone screenshots]
[appbox microsoftstore 9n8rl80hvm4t-mobile screenshots]
Machine Learning Q&A Part I:
Google.
Azure and AWS are second class citizens in this area.
Sure, AWS has 70% of the market.
Sure, Azure is the easiest turn key and super user friendly.
But, the king of machine learning in the cloud is GCP.
GCP = Google Cloud Platform
Google has the largest data science team in the world, not mention they have Hinton.
Let’s forgot for a minute they created TensorFlow and give it away.
Let’s just talk about building a real world model with data that doesn’t fit into a excel spreadsheet.
The vast majority of applied machine learning is supervised and that means we need data.
Not just normal data, we need very clean highly structured data.
Where’s the easiest place in the world to upload and model a Petabyte of structured data? BigQuery of course.
Why BigQuery? I don’t have to do anything but upload my data. No spinning up RedShit clusters or whatever I have to do in Azure, just upload and massage data with my familiar SQL. If I do have to wrangle my data it won’t take my six months to update 5 rows here, minutes usually.
Then, you’ll need a front end. Cloud datalab is a Jupyter notebook, which is good because I don’t want nor do I need anything else.
Then, with a single line of code I connect by datalab (Jupyter) notebook to my data in BigQuery and build away.
I’ve worked in all three and the only thing I care about is getting to my job the fastest and right now that means I build my models in GCP.
If you’re new to machine learning don’t start in GCP or any cloud vendor for that matter. Start learning Python from the comfort of your laptop.
The course below is free to the first 20.
The Complete Python Course for Machine Learning Engineers
Here, I want to share the best research paper on Machine Learning classification methods, titled ‘Do we Need Hundreds of Classifiers to Solve Real World Classification Problems?’, published in the ‘Journal of Machine Learning Research’.
This paper nicely explained 179 classification techniques and applied them on 121 data sets thus sharing small summary of the paper:
Do we Need Hundreds of Classifiers to Solve Real World Classification Problems?
The paper evaluated 179 classifiers arising from 17 ML families (discriminant analysis, Bayesian, neural networks, support vector machines, decision trees, rule-based classifiers, boosting, bagging, stacking, random forests and other ensembles, generalized linear models, nearest neighbours, partial least squares and principal component regression, logistic and multinomial regression, multiple adaptive regression splines and other methods), implemented in Weka, R ( with and without the caret package), C and Matlab, including all the relevant classifiers available today.
Experiments used total 121 data sets , which represent the whole UCI data base (excluding the large-scale problems) and other own real problems, in order to achieve significant conclusions about the classifier behaviour, not dependent on the data set collection.
The whole data set and partitions are available from: http://persoal.citius.usc.es/manuel.fernandez.delgado/papers/jmlr/data.tar.gz
The classifiers most likely to be the bests are the random forest (RF) versions, the best of which (implemented in R and accessed via caret) achieves 94.1% of the maximum accuracy overcoming 90% in the 84.3% of the data sets. However, the difference is not statistically significant with the second best, the SVM with Gaussian kernel implemented in C using LibSVM, which achieves 92.3% of the maximum accuracy. A few models are clearly better than the remaining ones: random forest, SVM with Gaussian and polynomial kernels, extreme learning machine with Gaussian kernel, C5.0 and avNNet (a committee of multi-layer perceptrons implemented in R with the caret package).
The random forest is clearly the best family of classifiers (3 out of 5 bests classifiers are RF), followed by SVM (4 classifiers in the top-10), neural networks and boosting ensembles (5 and 3 members in the top-20, respectively).
You can see the table with the complete results: http://persoal.citius.usc.es/manuel.fernandez.delgado/papers/jmlr/results.txt
I hope it will be helpful for Statistic and Machine Leaning aspirants!
Thank you!
These basic questions should help:
1. Is the classification going to be supervised or unsupervised? Several well defined techniques likes SVM (Support Vector Machines), trained neural net,etc. are applicable for supervised classification. For unsupervised classification, GMMs (Gaussian Mixture Models), HMMs (Hidden Markov models) with Baye’s techniques could be used. (Several other techniques could of course be used as well)
2.How much training data do you have in case it is supervised ? A small number of training data may yield discouraging classification accuracy even if the chosen classifier is the most suitable one for the problem. In such a case, try to obtain more number of samples. There’s also generally a correlation (for practical purposes at least) between the feature dimensionality and the number of samples for given technique. For example, while using SVM, the linear kernel tends to yield better results when the number of training samples are less than or equal to or only slightly more than the number of feature dimensions as compared to RBF or any other kernel.
3. If the feature vector dimensionality is small enough (1/2/3 -D) then it makes sense to plot and visually inspect if techniques like clustering could be more useful. With very high number of feature dimensions, methods like clustering are generally not advisable(Refer : “The Curse Of Dimensionality”).
4. Are you doing classification in real time ? Some techniques ,e.g. “Template Match” in image classification may lead to a higher number of errors but is generally faster than most other techniques if the number of templates to be evaluated are not excessively high.
5. Depending upon the problem domain, you can decide if you can choose the underlying model in such a way that it can use certain temporal/spatial correlations that may be inherent in the data. For example, HMMs use the temporal continuity of speech samples for enhancing classification results in speech recognition problems.
Another point, slightly off the topic perhaps, but the classification performance is as much a function of choosing the correct feature vectors, the pre-processing of the feature vectors as much as the classifier itself. It’s generally a good idea to give reserve some initial part of the project to try out various classifiers on the same data-set. It may at least help you reject the ones which are highly inaccurate.
At a high level, these skills are a combination of software and data engineering.
The persons that are more appropriate to do this job are a data engineer and/or a machine learning engineer.
That being said, if you work at a startup or happen to be in a small company and need to put the models into production yourself, here are the top skills you need to get:
- Well structured code: it doesn’t need to be perfect but at least can be understood and updated by other team members. Avoid spaghetti code[1] as the plague.
- Add logs: if you are a Python user, the logging[2] module is your friend. Avoid print statements at any cost.
- Model versioning: add a hash key to your different models. You will thank me later.
- Metadata everywhere: save as much data about your models and ML experiments as you can (running time, hyperparameters, used features, CV scores, and so on). You will thank me later, again.
- Monitor performances: execution time and statistical scores of your models.
- Data and models management: store the necessary data and models somewhere that is available to everyone (S3[3] for example). Avoid uploading these to your VCS[4] system. Don’t share them using Slack or Drive. I won’t judge you though, I do it sometimes (read often). Read more here …..
Some of the mistakes that might involve during building a machine learning model (I can think of) are listed here:
- Not understanding the structure of the dataset
- Not giving proper care during features selection
- Leaving out categorical features and considering just numerical variables
- Falling into dummy variable trap
- Selection of inefficient machine learning algorithm
- Not trying out various ML algorithms for building the model based on structure of data.
- Improper tuning of model parameters
- Most importantly: Building an idiotstic imperfect model i.e. suppose we have a classification problem with 99% chances of falling into class1 and remaining to class2. The built model may develop a mapping function which all the time for all data inputs, may predict the result to be class1. Well, one might say his/her model has 99% accuracy. But in reality the 1% class2 case hasn’t been included in the model. So this must be taken into consideration.
- Read more here…
[appbox appstore 1560083470-iphone screenshots]
[appbox googleplay com.awssolutionarchitectassociateexampreppro.app]
Basically, data mining is a key aspect of data analytics. Some even consider the former as essential to execute before the latter. While data analytics is the complete package and involves most components needed to examine a data set and extract valuable information, data mining focuses specifically on identifying hidden patterns.
That’s just the surface-level comparison though. The image above gives an overview of how the two differ.
One such difference is the presence of a hypothesis. Data analytics usually requires coming up with one, as it aims to find specific answers. Data mining, on the other hand, generally doesn’t need one to test or prove. The expected output are patterns or trends, which doesn’t require coming up with a statement or fact to test.
However, that doesn’t mean you mine data blindly. You still have a goal, whether it’s to come up with a recommender system or identify predictors of a certain dimension. Ultimately though, you strive to come up with data patterns or trends. For data analysis on the other hand, you’re expected to come up with valuable and actionable insights, usually in relation to a predetermined hypothesis. Read more here ….
The data science life cycle is not something well-defined like the software development life-cycle, and there is no ‘one-size-fits-all’ solution for data science projects. Every step in the life-cycle of a data science project depends on various data scientist skills and data science tools. The typical life-cycle of a data science project involves jumping back and forth among various interdependent science tasks using a variety of tools, techniques, programming, etc.
Thus, the data science life-cycle can include the following steps:
- Business requirement understanding.
- Data collection.
- Data cleaning.
- Data analysis.
- Modeling.
- Performance evaluation.
- Communicating with stakeholders.
- Deployment.
- Real-world testing.
- Business buy-in.
- Support and maintenance.
Looks neat, but here is the scheme to visualize how it is happening in reality:
Agile development processes, especially continuous delivery lends itself well to the data science project life-cycle. The early comparison helps the data science team to change approaches, refine hypotheses and even discard the project if the business case is nonviable or the benefits from the predictive models are not worth the effort to build it.
[appbox appstore 1611045854-iphone screenshots]
[appbox microsoftstore 9n8rl80hvm4t-mobile screenshots]
Machine Learning Q&A -Part II:
At a high level, these skills are a combination of software and data engineering.
The persons that are more appropriate to do this job are a data engineer and/or a machine learning engineer.
That being said, if you work at a startup or happen to be in a small company and need to put the models into production yourself, here are the top skills you need to get:
- Well structured code: it doesn’t need to be perfect but at least can be understood and updated by other team members. Avoid spaghetti code[1] as the plague.
- Add logs: if you are a Python user, the logging[2] module is your friend. Avoid print statements at any cost.
- Model versioning: add a hash key to your different models. You will thank me later.
- Metadata everywhere: save as much data about your models and ML experiments as you can (running time, hyperparameters, used features, CV scores, and so on). You will thank me later, again.
- Monitor performances: execution time and statistical scores of your models.
- Data and models management: store the necessary data and models somewhere that is available to everyone (S3[3] for example). Avoid uploading these to your VCS[4] system. Don’t share them using Slack or Drive. I won’t judge you though, I do it sometimes (read often). Read more here …..
Some of the mistakes that might involve during building a machine learning model (I can think of) are listed here:
- Not understanding the structure of the dataset
- Not giving proper care during features selection
- Leaving out categorical features and considering just numerical variables
- Falling into dummy variable trap
- Selection of inefficient machine learning algorithm
- Not trying out various ML algorithms for building the model based on structure of data.
- Improper tuning of model parameters
- Most importantly: Building an idiotstic imperfect model i.e. suppose we have a classification problem with 99% chances of falling into class1 and remaining to class2. The built model may develop a mapping function which all the time for all data inputs, may predict the result to be class1. Well, one might say his/her model has 99% accuracy. But in reality the 1% class2 case hasn’t been included in the model. So this must be taken into consideration.
- Read more here…
Basically, data mining is a key aspect of data analytics. Some even consider the former as essential to execute before the latter. While data analytics is the complete package and involves most components needed to examine a data set and extract valuable information, data mining focuses specifically on identifying hidden patterns.
That’s just the surface-level comparison though. The image above gives an overview of how the two differ.
One such difference is the presence of a hypothesis. Data analytics usually requires coming up with one, as it aims to find specific answers. Data mining, on the other hand, generally doesn’t need one to test or prove. The expected output are patterns or trends, which doesn’t require coming up with a statement or fact to test.
However, that doesn’t mean you mine data blindly. You still have a goal, whether it’s to come up with a recommender system or identify predictors of a certain dimension. Ultimately though, you strive to come up with data patterns or trends. For data analysis on the other hand, you’re expected to come up with valuable and actionable insights, usually in relation to a predetermined hypothesis. Read more here ….
The data science life cycle is not something well-defined like the software development life-cycle, and there is no ‘one-size-fits-all’ solution for data science projects. Every step in the life-cycle of a data science project depends on various data scientist skills and data science tools. The typical life-cycle of a data science project involves jumping back and forth among various interdependent science tasks using a variety of tools, techniques, programming, etc.
Thus, the data science life-cycle can include the following steps:
- Business requirement understanding.
- Data collection.
- Data cleaning.
- Data analysis.
- Modeling.
- Performance evaluation.
- Communicating with stakeholders.
- Deployment.
- Real-world testing.
- Business buy-in.
- Support and maintenance.
Looks neat, but here is the scheme to visualize how it is happening in reality:
Agile development processes, especially continuous delivery lends itself well to the data science project life-cycle. The early comparison helps the data science team to change approaches, refine hypotheses and even discard the project if the business case is nonviable or the benefits from the predictive models are not worth the effort to build it.
Machine Learning Latest News
Top 10 Machine Learning Algorithms
What are the simplest examples of machine learning algorithms?
Source: Top 10 Machine Learning Algorithms for Data Scientist
In machine learning, there’s something called the “No Free Lunch” theorem. In a nutshell, it states that no one algorithm works best for every problem. It’s especially relevant for supervised learning. For example, you can’t say that neural networks are always better than decision trees or vice-versa. Furthermore, there are many factors at play, such as the size and structure of your dataset. As a result, you should try many different algorithms for your problem!
Top ML Algorithms
1. Linear Regression
Regression is a technique for numerical prediction. Additionally, regression is a statistical measure that attempts to determine the strength of the relationship between two variables. One is a dependent variable. Other is from a series of other changing variables which are our independent variables. Moreover, just like Classification is for predicting categorical labels, Regression is for predicting a continuous value. For example, we may wish to predict the salary of university graduates with 5 years of work experience. We use regression to determine how much specific factors or sectors influence the dependent variable.
Linear regression attempts to model the relationship between a scalar variable and explanatory variables by fitting a linear equation. For example, one might want to relate the weights of individuals to their heights using a linear regression model.
Additionally, this operator calculates a linear regression model. It uses the Akaike criterion for model selection. Furthermore, the Akaike information criterion is a measure of the relative goodness of a fit of a statistical model.
2. Logistic Regression
Logistic regression is a classification model. It uses input variables to predict a categorical outcome variable. The variable can take on one of a limited set of class values. A binomial logistic regression relates to two binary output categories. A multinomial logistic regression allows for more than two classes. Examples of logistic regression include classifying a binary condition as “healthy” / “not healthy”. Logistic regression applies the logistic sigmoid function to weighted input values to generate a prediction of the data class.
A logistic regression model estimates the probability of a dependent variable as a function of independent variables. The dependent variable is the output that we are trying to predict. The independent variables or explanatory variables are the factors that we feel could influence the output. Multiple regression refers to regression analysis with two or more independent variables. Multivariate regression, on the other hand, refers to regression analysis with two or more dependent variables.
3. Linear Discriminant Analysis
Logistic Regression is a classification algorithm traditionally for two-class classification problems. If you have more than two classes then the Linear Discriminant Analysis algorithm is the preferred linear classification technique.
The representation of LDA is pretty straight forward. It consists of statistical properties of your data, calculated for each class. For a single input variable this includes:
- The mean value for each class.
- The variance calculated across all classes.
We make predictions by calculating a discriminate value for each class. After that we make a prediction for the class with the largest value. The technique assumes that the data has a Gaussian distribution. Hence, it is a good idea to remove outliers from your data beforehand. It’s a simple and powerful method for classification predictive modelling problems.
4. Classification and Regression Trees
Prediction Trees are for predicting response or class YY from input X1, X2,…,XnX1,X2,…,Xn. If it is a continuous response it is a regression tree, if it is categorical, it is a classification tree. At each node of the tree, we check the value of one the input XiXi. Depending on the (binary) answer we continue to the left or to the right subbranch. When we reach a leaf we will find the prediction.
Contrary to linear or polynomial regression which are global models, trees try to partition the data space into small enough parts where we can apply a simple different model on each part. The non-leaf part of the tree is just the procedure to determine for each data xx what is the model we will use to classify it.
5. Naive Bayes
A Naive Bayes Classifier is a supervised machine-learning algorithm that uses the Bayes’ Theorem, which assumes that features are statistically independent. The theorem relies on the naive assumption that input variables are independent of each other, i.e. there is no way to know anything about other variables when given an additional variable. Regardless of this assumption, it has proven itself to be a classifier with good results.
Naive Bayes Classifiers rely on the Bayes’ Theorem, which is based on conditional probability or in simple terms, the likelihood that an event (A) will happen given that another event (B) has already happened. Essentially, the theorem allows a hypothesis to be updated each time new evidence is introduced. The equation below expresses Bayes’ Theorem in the language of probability:
Let’s explain what each of these terms means.
- “P” is the symbol to denote probability.
- P(A | B) = The probability of event A (hypothesis) occurring given that B (evidence) has occurred.
- P(B | A) = The probability of the event B (evidence) occurring given that A (hypothesis) has occurred.
- P(A) = The probability of event B (hypothesis) occurring.
- P(B) = The probability of event A (evidence) occurring.
6. K-Nearest Neighbors
k-nearest neighbours (or k-NN for short) is a simple machine learning algorithm that categorizes an input by using its k nearest neighbours.
For example, suppose a k-NN algorithm has an input of data points of specific men and women’s weight and height, as plotted below. To determine the gender of an unknown input (green point), k-NN can look at the nearest k neighbours (suppose ) and will determine that the input’s gender is male. This method is a very simple and logical way of marking unknown inputs, with a high rate of success.
Also, we can k-NN in a variety of machine learning tasks; for example, in computer vision, k-NN can help identify handwritten letters and in gene expression analysis, the algorithm can determine which genes contribute to a certain characteristic. Overall, k-nearest neighbours provide a combination of simplicity and effectiveness that makes it an attractive algorithm to use for many machine learning tasks.
7. Learning Vector Quantization
A downside of K-Nearest Neighbors is that you need to hang on to your entire training dataset. The Learning Vector Quantization algorithm (or LVQ for short) is an artificial neural network algorithm that allows you to choose how many training instances to hang onto and learns exactly what those instances should look like.
Additionally, the representation for LVQ is a collection of codebook vectors. We select them randomly in the beginning and adapted to best summarize the training dataset over a number of iterations of the learning algorithm. After learned, the codebook vectors can make predictions just like K-Nearest Neighbors. Also, we find the most similar neighbour (best matching codebook vector) by calculating the distance between each codebook vector and the new data instance. The class value or (real value in the case of regression) for the best matching unit is then returned as the prediction. Moreover, you can get the best results if you rescale your data to have the same range, such as between 0 and 1.
If you discover that KNN gives good results on your dataset try using LVQ to reduce the memory requirements of storing the entire training dataset.
8. Bagging and Random Forest
A Random Forest consists of a collection or ensemble of simple tree predictors, each capable of producing a response when presented with a set of predictor values. For classification problems, this response takes the form of a class membership, which associates, or classifies, a set of independent predictor values with one of the categories present in the dependent variable. Alternatively, for regression problems, the tree response is an estimate of the dependent variable given the predictors.e
A Random Forest consists of an arbitrary number of simple trees, which determine the final outcome. For classification problems, the ensemble of simple trees votes for the most popular class. In the regression problem, we average responses to obtain an estimate of the dependent variable. Using tree ensembles can lead to significant improvement in prediction accuracy (i.e., better ability to predict new data cases).
9. SVM
A Support Vector Machine (SVM) is a supervised machine learning algorithm that can be employed for both classification and regression purposes. Also, SVMs have more common usage in classification problems and as such, this is what we will focus on in this post.
SVMs are based on the idea of finding a hyperplane that best divides a dataset into two classes, as shown in the image below.
Also, you can think of a hyperplane as a line that linearly separates and classifies a set of data.
Intuitively, the further from the hyperplane our data points lie, the more confident we are that they have been correctly classified. We, therefore, want our data points to be as far away from the hyperplane as possible, while still being on the correct side of it.
So when we add a new testing data , whatever side of the hyperplane it lands will decide the class that we assign to it.
The distance between the hyperplane and the nearest data point from either set is the margin. Furthermore, the goal is to choose a hyperplane with the greatest possible margin between the hyperplane and any point within the training set, giving a greater chance of correct classification of data.
But the data is rarely ever as clean as our simple example above. A dataset will often look more like the jumbled balls below which represent a linearly non-separable dataset.
10. Boosting and AdaBoost
Boosting is an ensemble technique that attempts to create a strong classifier from a number of weak classifiers. We do this by building a model from the training data, then creating a second model that attempts to correct the errors from the first model. We can add models until the training set is predicted perfectly or a maximum number of models are added.
AdaBoost was the first really successful boosting algorithm developed for binary classification. It is the best starting point for understanding boosting. Modern boosting methods build on AdaBoost, most notably stochastic gradient boosting machines.
AdaBoost is used with short decision trees. After the first tree is created, the performance of the tree on each training instance is used to weight how much attention the next tree that is created should pay attention to each training instance. Training data that is hard to predict is given more weight, whereas easy to predict instances are given less weight. Models are created sequentially one after the other, each updating the weights on the training instances that affect the learning performed by the next tree in the sequence. After all the trees are built, predictions are made for new data, and the performance of each tree is weighted by how accurate it was on training data.
Because so much attention is put on correcting mistakes by the algorithm it is important that you have clean data with outliers removed.
Summary
A typical question asked by a beginner, when facing a wide variety of machine learning algorithms, is “which algorithm should I use?” The answer to the question varies depending on many factors, including: (1) The size, quality, and nature of data; (2) The available computational time; (3) The urgency of the task; and (4) What you want to do with the data.
Even an experienced data scientist cannot tell which algorithm will perform the best before trying different algorithms. Although there are many other Machine Learning algorithms, these are the most popular ones. If you’re a newbie to Machine Learning, these would be a good starting point to learn.
Follow this link, if you are looking to learn Data Science Course Online!
Additionally, if you are having an interest in learning Data Science, Learn online Data Science Course to boost your career in Data Science.
Also, learn AWS Big Data Course click here, AWS Online Course
Furthermore, if you want to read more about data science, read this Data Science blogs
The foundations of most algorithms lie in linear algebra, multivariable calculus, and optimization methods. Most algorithms use a sequence of combinations to estimate an objective function given a set of data, and the sequence order and included methods distinguish one algorithm from another. It’s helpful to learn enough math to read the development papers associated with key algorithms in the field, as many other methods (or one’s own innovations) include pieces of those algorithms. It’s like learning the language of machine learning. Once you are fluent in it, it’s pretty easy to modify algorithms as needed and create new ones likely to improve on a problem in a short period of time.
Matrix factorization: a simple, beautiful way to do dimensionality reduction —and dimensionality reduction is the essence of cognition. Recommender systems would be a big application of matrix factorization. Another application I’ve been using over the years (starting in 2010 with video data) is factorizing a matrix of pairwise mutual information (or pointwise mutual information, which is more common) between features, which can be used for feature extraction, computing word embeddings, computing label embeddings (that was the topic of a recent paper of mine [1]), etc.
Used in a convolutional settings, this acts as an excellent unsupervised feature extractor for images and videos. There’s one big issue though: it is fundamentally a shallow algorithm. Deep neural networks will quickly outperform it if any kind of supervision labels are available.
[1] [1607.05691] Information-theoretical label embeddings for large-scale image classification
Machine Learning Demos:

See how well you synchronize to the lyrics of the popular hit “Dance Monkey.” This in-browser experience uses the Facemesh model for estimating key points around the lips to score lip-syncing accuracy.Explore demo View code

Use your phone’s camera to identify emojis in the real world. Can you find all the emojis before time expires?Explore demo View code

Play Pac-Man using images trained in your browser.Explore demo View code
No coding required! Teach a machine to recognize images and play sounds.Explore demo View code

Explore pictures in a fun new way, just by moving around.Explore demo View code

Enjoy a real-time piano performance by a neural network.Explore demo View code
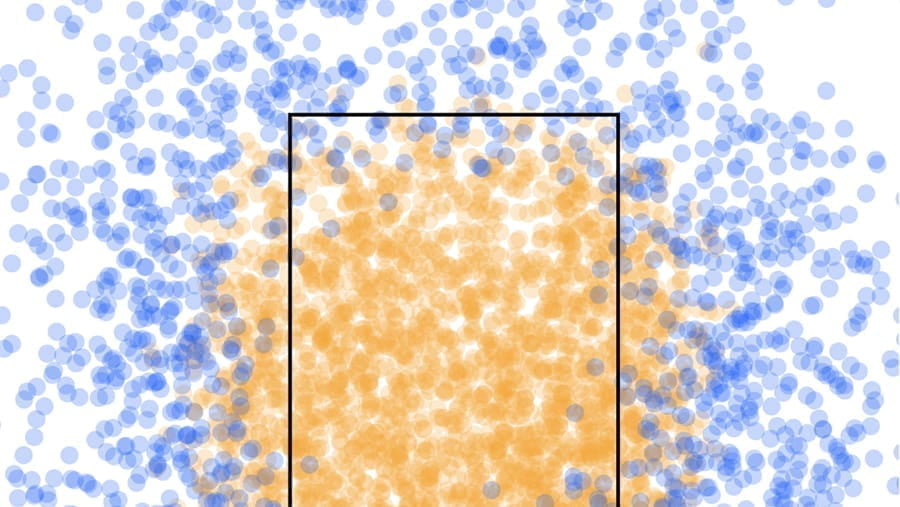
Train a server-side model to classify baseball pitch types using Node.js.View code
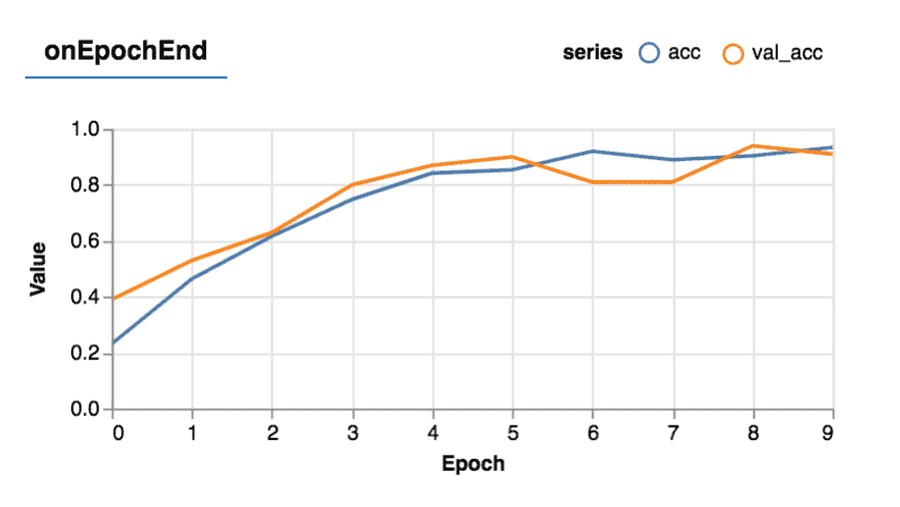
See how to visualize in-browser training and model behaviour and training using tfjs-vis.Explore demo View code
Community demos
Get started with official templates and explore top picks from the community for inspiration.Glitch
Check out community Glitches and make your own TensorFlow.js-powered projects.Explore Glitch Codepen
Fork boilerplate templates and check out working examples from the community.Explore CodePen GitHub Community Projects
See what the community has created and submitted to the TensorFlow.js gallery page.Explore GitHub
 https://cdpn.io/jasonmayes/fullcpgrid/QWbNeJdOpen in Editor
Real time body segmentation using TensorFlow.js
Load in a pre-trained Body-Pix model from the TensorFlow.js team so that you can locate all pixels in an image that are part of a body, and what part of the body they belong to. Clone this to make your own TensorFlow.js powered projects to recognize body parts in images from your webcam and more!
New Pen from Template https://cdpn.io/jasonmayes/fullcpgrid/qBEJxggOpen in Editor
Multiple object detection using pre trained model in TensorFlow.js
This demo shows how we can use a pre made machine learning solution to recognize objects (yes, more than one at a time!) on any image you wish to present to it. Even better, not only do we know that the image contains an object, but we can also get the co-ordinates of the bounding box for each object it finds, which allows you to highlight the found object in the image.
For this demo we are loading a model using the ImageNet-SSD architecture, to recognize 90 common objects it has already been taught to find from the COCO dataset.
If what you want to recognize is in that list of things it knows about (for example a cat, dog, etc), this may be useful to you as is in your own projects, or just to experiment with Machine Learning in the browser and get familiar with the possibilities of machine learning.
If you are feeling particularly confident you can check out our GitHub documentation (https://github.com/tensorflow/tfjs-models/tree/master/coco-ssd) which goes into much more detail for customizing various parameters to tailor performance to your needs.
New Pen from Template https://cdpn.io/jasonmayes/fullcpgrid/JjompwwOpen in Editor
Classifying images using a pre trained model in TensorFlow.js
This demo shows how we can use a pre made machine learning solution to classify images (aka a binary image classifier). It should be noted that this model works best when a single item is in the image at a time. Busy images may not work so well. You may want to try our demo for Multiple Object Detection (https://codepen.io/jasonmayes/pen/qBEJxgg) for that.
For this demo we are loading a model using the MobileNet architecture, to recognize 1000 common objects it has already been taught to find from the ImageNet data set (http://image-net.org/).
If what you want to recognize is in that list of things it knows about (for example a cat, dog, etc), this may be useful to you as is in your own projects, or just to experiment with Machine Learning in the browser and get familiar with the possibilities of machine learning.
Please note: This demo loads an easy to use JavaScript class made by the TensorFlow.js team to do the hardwork for you so no machine learning knowledge is needed to use it.
If you were looking to learn how to load in a TensorFlow.js saved model directly yourself then please see our tutorial on loading TensorFlow.js models directly.
If you want to train a system to recognize your own objects, using your own data, then check out our tutorials on “transfer learning”.
New Pen from Template Open in Editor
Tensorflow.js Boilerplate
The hello world for TensorFlow.js 🙂 Absolute minimum needed to import into your website and simply prints the loaded TensorFlow.js version. From here we can do great things. Clone this to make your own TensorFlow.js powered projects or if you are following a tutorial that needs TensorFlow.js to work.
Examples
tfjs-examples provides small code examples that implement various ML tasks using TensorFlow.js.MNIST Digit Recognizer
Train a model to recognize handwritten digits from the MNIST database.Explore example View code Addition RNN
Train a model to learn addition from text examples.Explore example View code
TensorFlow.js Layers: Iris Demo
More TensorFlow examples
Top-paying Cloud certifications:
[appbox appstore 1611045854-iphone screenshots]
[appbox microsoftstore 9n8rl80hvm4t-mobile screenshots]
- Google Certified Professional Cloud Architect — $175,761/year
- AWS Certified Solutions Architect – Associate — $149,446/year
- Azure/Microsoft Cloud Solution Architect – $141,748/yr
- Google Cloud Associate Engineer – $145,769/yr
- AWS Certified Cloud Practitioner — $131,465/year
- Microsoft Certified: Azure Fundamentals — $126,653/year
- Microsoft Certified: Azure Administrator Associate — $125,993/year
Supervised Learning
Linear Regression
Logistic Regression
Naive Bayes
Support Vector Machines
Decision Trees
K-Nearest Neighbors
Machine Learning in Practice
Bias-Variance Tradeoff
How to Select a Model
How to Select Features
Regularizing Your Model
Ensembling: How to Combine Your Models
Evaluation Metrics
Unsupervised Learning
Market Basket Analysis
K-Means Clustering
Principal Components Analysis
Deep Learning
Feedforward Neural Networks
Grab Bag of Neural Network Practices
Convolutional Neural Networks
Recurrent Neural Networks
Test Your Knowledge
Best Subset Features Feature
Selection Examples
Adding Features Example
Activation Practice I
Activation Practice II
Activation Practice III
Weight Initialization
Batch vs. Stochastic
Convolutional Application
Convolutional Layer Advantages
Are you interested in becoming an AWS Certified Machine Learning Specialist? If so, then this exam preparation blog is for you! The blog contains over 100 quiz and practice exam questions, as well as detailed answers. The questions are very similar to those you will encounter on the actual exam, so this is a great way to prepare. In addition, the blog also includes cheat sheets and illustrations to help you understand the concepts better.
Bring your own algorithm to an MLOps Pipeline: Architecture


Code and Serve Your ML Model with AWS CodeBuild
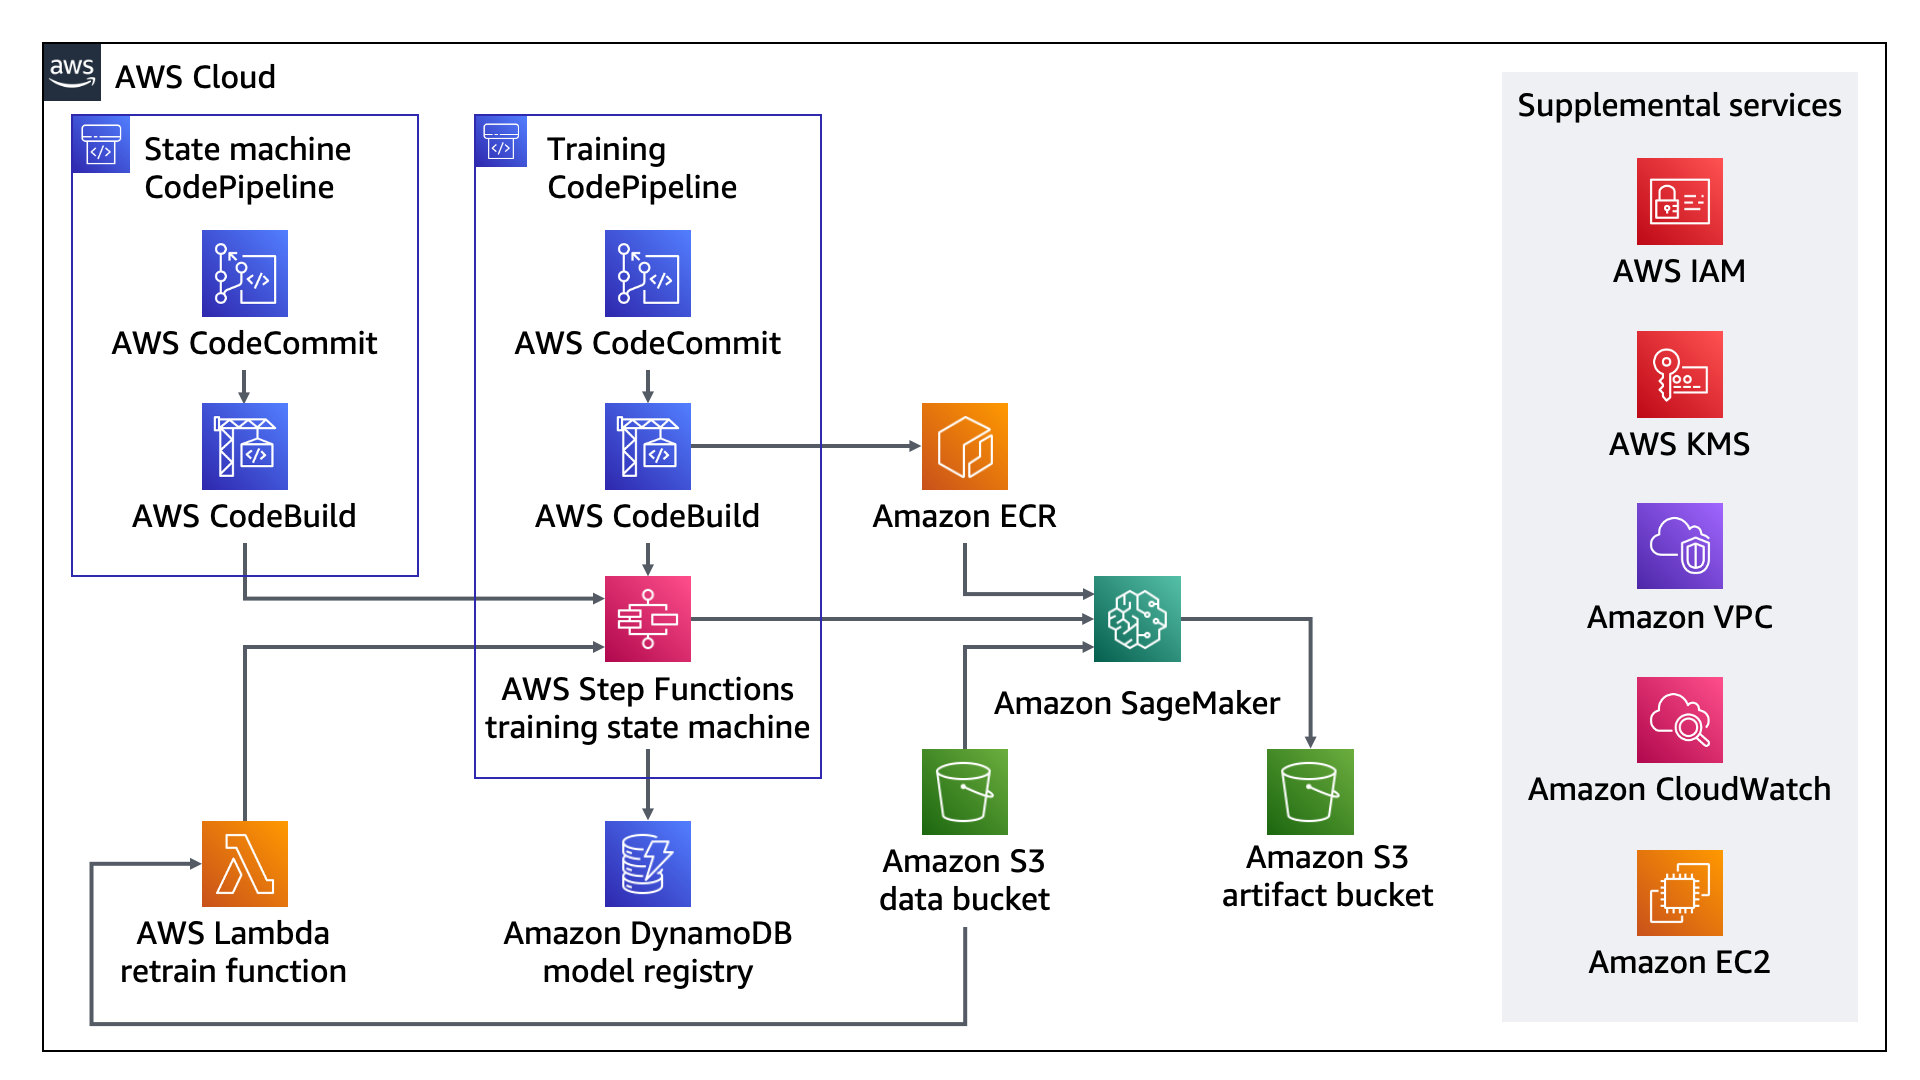
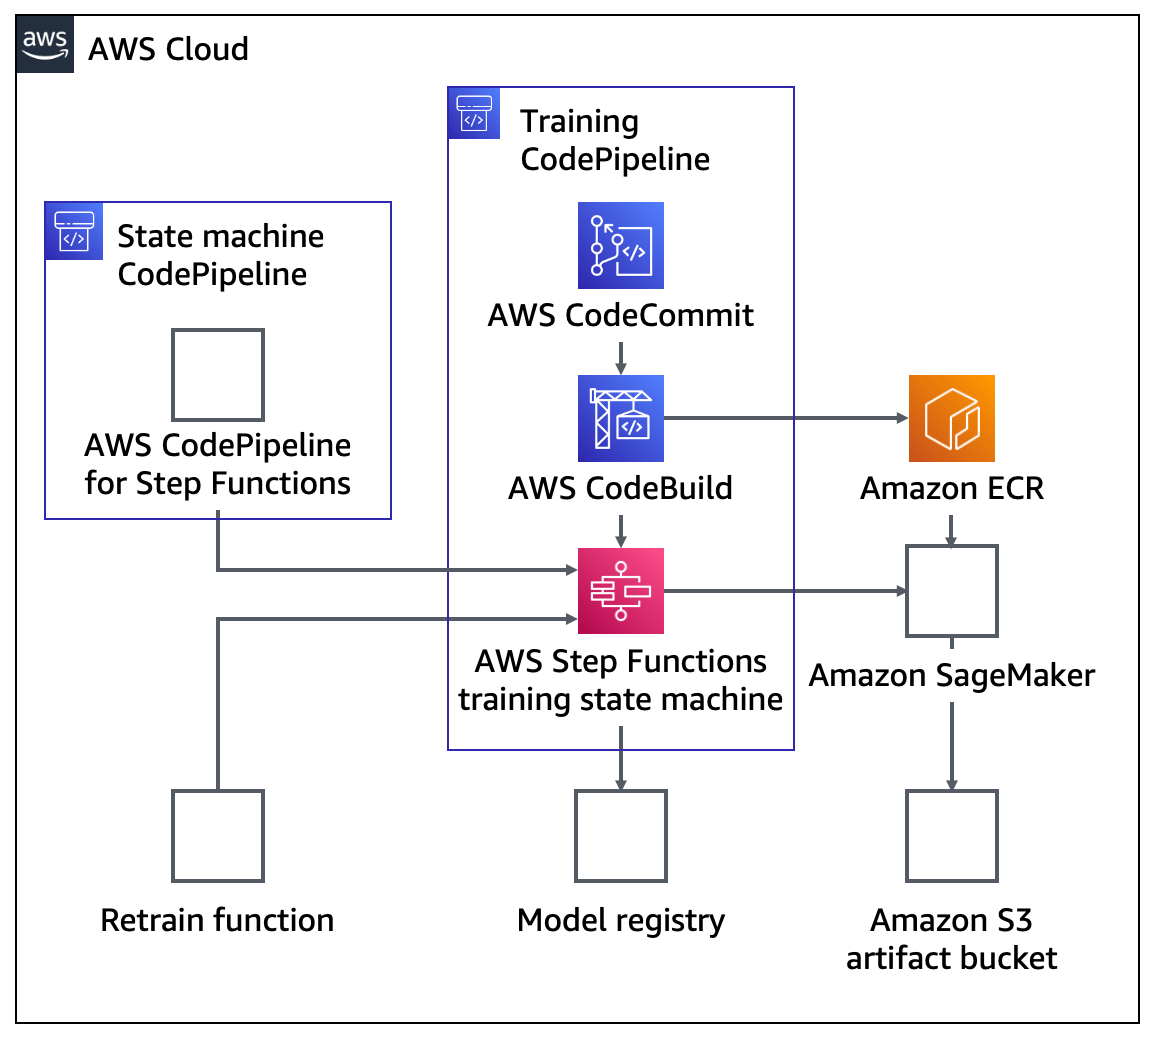
What are some ways we can use machine learning and artificial intelligence for algorithmic trading in the stock market?
How do we know that the Top 3 Voice Recognition Devices like Siri Alexa and Ok Google are not spying on us?
What are some good datasets for Data Science and Machine Learning?
Machine Learning Engineer Interview Questions and Answers
- Master of Data Scienceby /u/LifeIsAJoke7 (Data Science) on April 25, 2024 at 11:52 pm
Hello everyone! I am a business analytics graduate soon, and I want to expand on my skills in data science with an online masters from University of Pittsburgh. I want to fast track my career in the best way possible. The course names are listed in the image in case you cant find it in the link. I have done a lot of research on masters programs and so far, this is the best I have gotten so far in terms of my chance at being admitted with my GPA and major. So my question/advice seeking is, whether anyone knows of good programs a person with my profile can get into. Also, Does the fact that it’s called “Master of Science” instead of “Masters of Science in Data Science” matter? Profile: Major: Information Systems and Business Analytics Minor: Data Science GPA: 3.0 Thank you! submitted by /u/LifeIsAJoke7 [link] [comments]
- Gooogle Colab Scheduleby /u/Uncle_Cheeto (Data Science) on April 25, 2024 at 11:19 pm
Has anyone successfully been able to schedule a Google Colab Python notebook to run on its own? I know Databricks has that functionality…. Just stumped with Colab. YouTube has yet to be helpful. submitted by /u/Uncle_Cheeto [link] [comments]
- Datasets for Causal MLby /u/Direct-Touch469 (Data Science) on April 25, 2024 at 6:29 pm
Does anyone know what datasets are out there for causal inference? I’d like to explore methods in the doubly robust ML literature, and I’d like to compensate my learning by working on some datasets and learn the econML software. Does anyone know of any datasets, specifically in the context of marketing/pricing/advertising that would be good sources to apply causal inference techniques? I’m open to other datasets as well. submitted by /u/Direct-Touch469 [link] [comments]
- [D] Transitioning from Operations Research Scientist to ML/AI/CV Engineerby /u/unsuccessful_boy (Machine Learning) on April 25, 2024 at 4:20 pm
Hello fellow smart people on Reddit, recently I've been thinking about changing my job (I'm a Vision Engineer) and I stumbled upon this position on LinkedIn called Operations Research Scientist. I was wondering after a few years (maybe at most 2) of working in that position, will it be easier for me to transition to a Machine Learning/Artificial Intelligence Engineer or maybe a Computer Vision Engineer role? submitted by /u/unsuccessful_boy [link] [comments]
- [R] Speculative Streaming: Fast LLM Inference without Auxiliary Modelsby /u/SeawaterFlows (Machine Learning) on April 25, 2024 at 4:13 pm
Paper: https://arxiv.org/abs/2402.11131 Abstract: Speculative decoding is a prominent technique to speed up the inference of a large target language model based on predictions of an auxiliary draft model. While effective, in application-specific settings, it often involves fine-tuning both draft and target models to achieve high acceptance rates. As the number of downstream tasks grows, these draft models add significant complexity to inference systems. We propose Speculative Streaming, a single-model speculative decoding method that fuses drafting into the target model by changing the fine-tuning objective from next token prediction to future n-gram prediction. Speculative Streaming speeds up decoding by 1.8 - 3.1X in a diverse set of tasks, such as Summarization, Structured Queries, and Meaning Representation, without sacrificing generation quality. Additionally, Speculative Streaming is parameter-efficient. It achieves on-par/higher speed-ups than Medusa-style architectures while using ~10000X fewer extra parameters, making it well-suited for resource-constrained devices. submitted by /u/SeawaterFlows [link] [comments]
- [R] Lossless Acceleration of Large Language Model via Adaptive N-gram Parallel Decodingby /u/SeawaterFlows (Machine Learning) on April 25, 2024 at 4:08 pm
Paper: https://arxiv.org/abs/2404.08698 Abstract: While Large Language Models (LLMs) have shown remarkable abilities, they are hindered by significant resource consumption and considerable latency due to autoregressive processing. In this study, we introduce Adaptive N-gram Parallel Decoding (ANPD), an innovative and lossless approach that accelerates inference by allowing the simultaneous generation of multiple tokens. ANPD incorporates a two-stage approach: it begins with a rapid drafting phase that employs an N-gram module, which adapts based on the current interactive context, followed by a verification phase, during which the original LLM assesses and confirms the proposed tokens. Consequently, ANPD preserves the integrity of the LLM's original output while enhancing processing speed. We further leverage a multi-level architecture for the N-gram module to enhance the precision of the initial draft, consequently reducing inference latency. ANPD eliminates the need for retraining or extra GPU memory, making it an efficient and plug-and-play enhancement. In our experiments, models such as LLaMA and its fine-tuned variants have shown speed improvements up to 3.67x, validating the effectiveness of our proposed ANPD. submitted by /u/SeawaterFlows [link] [comments]
- “What motivates you?” What’s the best answer besides compensation?by /u/Curious-Fig-9882 (Data Science) on April 25, 2024 at 3:56 pm
I am wondering if anyone has encountered this question in job applications or interviews and what the best answers might be? Honestly, besides being adequately compensated, I am motivated by challenges that allow me to learn, a supportive environment, and a clear direction for growth. What would be your answers? submitted by /u/Curious-Fig-9882 [link] [comments]
- [D] Old Paper - Troubling Trends in Machine Learning Scholarshipby /u/pyepyepie (Machine Learning) on April 25, 2024 at 3:50 pm
I just wanted to remind or introduce newcomers to this paper. I think this discussion should be re-opened since many people here actually do influence the trends of the field. https://arxiv.org/pdf/1807.03341 On a personal note (feel free to skip): Specifically, I want to point out the issue of "Mathiness", as it seems like this problem got way out of hand and most best papers of conferences suffer from it (one of the most important ML papers tried to be mathy and introduced a big mistake, I believe other papers have bigger issues but no one bothers to check it). So here are my personal points to academics and researchers: We (I think most will relate), practitioners, do not need equations to know what recall is and clearly don't want to read difficult-to-understand versions of what linear regression is, it just makes your paper unuseful. If you don't want to waste our time, please put it in the appendix or completely remove it. Reviewers, please don't get impressed by unnecessary math, if it's complicated and does nothing useful, who cares? Also, it might be flawed anyway and you will probably not catch it. submitted by /u/pyepyepie [link] [comments]
- [R] Python package for animated time seriesby /u/SatieGonzales (Machine Learning) on April 25, 2024 at 3:48 pm
In this video about Times Series, https://www.youtube.com/watch?v=0zpg9ODE6Ww, does anyone have an idea about the Python package used to create the animated plots showed at the 34th minute of the video ? Thank for your help. submitted by /u/SatieGonzales [link] [comments]
- [D] UAI-2024 results waiting areaby /u/PaganPasta (Machine Learning) on April 25, 2024 at 3:38 pm
Following the review phase(old post), creating a thread for others like me waiting for the decision. All the best! submitted by /u/PaganPasta [link] [comments]
- [D] Why transformers are not trained layer-wise?by /u/kiockete (Machine Learning) on April 25, 2024 at 2:16 pm
It seems to me that thanks to the residual path the gradient that flows to each layer is the same regardless of the transformer layer/block. Example: ProjectionAndCost(X + L1(X) + L2(X + L1(X)) + L3(X + L1(X) + L2(X + L1(X))) ...) Since the input to ProjectionAndCost is just sum of outputs from all layers and initial embeddings then the gradient that comes to the layer L1 is the same as the gradient that comes to L2 or L3. So we could: first train only L1: ProjectionAndCost(X + L1(X)) freeze L1, include L2 and train: ProjectionAndCost(X + L1(X) + L2(X + L1(X))) freeze L1 and L2, include L3 and train: ProjectionAndCost(X + L1(X) + L2(X + L1(X)) + L3(X + L1(X) + L2(X + L1(X)))) .. and so on We can't train first L2 then L1, because the input to L2 depends on L1, but we could train lower layers first then gradually add and train deeper layers. Is there any problem with that approach? submitted by /u/kiockete [link] [comments]
- [D] Is there an equivalent BigDL project for NVIDIA GPUs, which allows distributing work loads across a DL cluster with spark?by /u/PepperGrind (Machine Learning) on April 25, 2024 at 10:18 am
So there's this relatively new "BigDL" project" (https://bigdl.readthedocs.io/en/latest/ ), which is for Intel CPUs and Intel GPUs, but there's no mention anywhere of it working for NVIDIA GPUs. Is there any equivalent library for NVIDIA GPUs on a spark cluster? submitted by /u/PepperGrind [link] [comments]
- [P] New Book: BUILD GPT: HOW AI WORKSby /u/Pure_Nerve_595 (Machine Learning) on April 25, 2024 at 10:08 am
After having worked on it for many months, I am now excited that my new book, “BUILD GPT: HOW AI WORKS”, is available on Amazon. It goes through the process of building a GPT from scratch and explains how it works. I want to thank everyone who has helped me with this book, they are in the acknowledgment section. Please feel free to share this book with anyone interested in learning about GPTs or interested in building GPTs. https://preview.redd.it/ixhw5wz9mlwc1.png?width=1507&format=png&auto=webp&s=5f9a0eb5d1f49ed936f12e4527950090d161852c submitted by /u/Pure_Nerve_595 [link] [comments]
- [D] What is the best TTS model for my case?by /u/hwk06023 (Machine Learning) on April 25, 2024 at 8:07 am
Hi. Here is the new's question. The biggest concern is the rate of generation. I want to generate about 5 seconds of voice in about 100ms. I want to know which model performs best(SOTA) under those conditions. Which model is best for me? I think "styletts2" is best. If you have any relevant experience or know any other information, I would really appreciate your help. Thank you ! submitted by /u/hwk06023 [link] [comments]
- [R] French GEC datasetby /u/R-e-v-e-r-i-e- (Machine Learning) on April 25, 2024 at 12:14 am
Hi, does anyone know of a French L2 GEC dataset (that was published at a conference)? submitted by /u/R-e-v-e-r-i-e- [link] [comments]
- [D] tutorial on how to build streaming ML applicationsby /u/clementruhm (Machine Learning) on April 24, 2024 at 10:16 pm
My primary expertise is audio processing, but i believe this task happens in other domains too: running a model on chunks of infinitely long input. while for some architectures it is straightforward, it can get tedious for convolutional nets. I put together a comprehensive tutorial how to build a streaming ML applications: https://balacoon.com/blog/streaming\_inference/. would be curious to learn wether its a common problem and how do people usually deal with it. Because resources on the topic are surprisingly scarce. submitted by /u/clementruhm [link] [comments]
- [D] Why is R^2 so crazy?by /u/Cloverdover1 (Machine Learning) on April 24, 2024 at 9:40 pm
https://preview.redd.it/jpiyt4b9yhwc1.png?width=1165&format=png&auto=webp&s=95d80f8f9c9241d722717ad25215be4077d541ca Based on the MSE looks good right? But why is my R^2 starting off so negative and approaching 0? Could it be a bug in how i am calculating it? This happened after i min maxed the labels before training. This is an LSTM that is predicting runs scored for baseball games. submitted by /u/Cloverdover1 [link] [comments]
- What is the difference between a data scientist and a data analyst role?by /u/Level-Upstairs-3971 (Data Science) on April 24, 2024 at 5:46 pm
After 20+ years in the field, I'm not sure what I should call myself 🙂 submitted by /u/Level-Upstairs-3971 [link] [comments]
- Recall Score Increase [D]by /u/Legal_Hearing555 (Machine Learning) on April 24, 2024 at 5:38 pm
Hello Everyone, I am trying to do a small fraud detection project and i have so imbalanced dataset. I used randomundersampling because minority class is pretty small and i also tried smote or combining with smote best recall score i got, was with only randomundersampling(0.95). I thought GridsearchCV to increase it but instead of increasing, it is decreasing although i tried to make it to focus on recall score. Why this is happening? submitted by /u/Legal_Hearing555 [link] [comments]
- [D] Preserving spatial distribution of data during data splittingby /u/dr_greg_mouse (Machine Learning) on April 24, 2024 at 5:14 pm
Hello, I am trying to model nitrate concentrations in the streams in Bavaria in Germany using Random Forest model. I am using Python and primarily sklearn for the same. I have data from 490 water quality stations. I am following the methodology in the paper from LongzhuQ.Shen et al which can be found here: https://www.nature.com/articles/s41597-020-0478-7 I want to split my dataset into training and testing set such that the spatial distribution of data in both sets is identical. The idea is that if data splitting ignores the spatial distribution, there is a risk that the training set might end up with a concentration of points from densely populated areas, leaving out sparser areas. This can skew the model's learning process, making it less accurate or generalizable across the entire area of interest. sklearn train_test_split just randomly divides the data into training and testing sets and it does not consider the spatial patterns in the data. The paper I mentioned above follows this methodology: "We split the full dataset into two sub-datasets, training and testing respectively. To consider the heterogeneity of the spatial distribution of the gauge stations, we employed the spatial density estimation technique in the data splitting step by building a density surface using Gaussian kernels with a bandwidth of 50 km (using v.kernel available in GRASS GIS33) for each species and season. The pixel values of the resultant density surface were used as weighting factors to split the data into training and testing subsets that possess identical spatial distributions." I want to follow the same methodology but instead of using grass GIS, I am just building the density surface myself in Python. I have also extracted the probability density values and the weights for the stations. (attached figure) Now the only problem I am facing is how do I use these weights to split the data into training and testing sets? I checked there is no keyword in the sklearn train_test_split function that can consider the weights. I also went back and forth with chat GPT 4 but it is also not able to give me a clear answer. Neither did I find anything concrete on the internet about this. Maybe I am missing something. Is there any other function I can use to do this? Or will I have to write my own algorithm to do the splitting? In case of the latter, can you please suggest me the approach so I can code it myself? In the attached figure you can see the location of the stations and the probability density surface generated using the kernel density estimation method (using Gaussian kernels). Also attaching a screenshot of my dataframe to give you some idea of the data structure. (all columns after longitude ('lon') column are used as features. the NO3 column is used as the target variable.) I will be grateful for any answers. Probability density surface generated using the kernel density estimation method with gaussian kernels. the dataset I am using to model the nitrate concentrations submitted by /u/dr_greg_mouse [link] [comments]
Big Data and Data Analytics 101 – Top 100 AWS Certified Data Analytics Specialty Certification Questions and Answers Dumps
AI Dashboard is available on the Web, Apple, Google, and Microsoft, PRO version
Top 100 AWS Certified Data Analytics Specialty Certification Questions and Answers Dumps
If you’re looking to take your data analytics career to the next level, then this AWS Data Analytics Specialty Certification Exam Preparation blog is a must-read! With over 100 exam questions and answers, plus data science and data analytics interview questions, cheat sheets and more, you’ll be fully prepared to ace the DAS-C01 exam.
In this blog, we talk about big data and data analytics; we also give you the last updated top 100 AWS Certified Data Analytics – Specialty Questions and Answers Dumps
The AWS Certified Data Analytics – Specialty (DAS-C01) examination is intended for individuals who perform in a data analytics-focused role. This exam validates an examinee’s comprehensive understanding of using AWS services to design, build, secure, and maintain analytics solutions that provide insight from data.
Download the App for an interactive experience:
Get 20% off Google Google Workspace (Google Meet) Standard Plan with the following codes: 96DRHDRA9J7GTN6
Get 20% off Google Workspace (Google Meet) Business Plan (AMERICAS): M9HNXHX3WC9H7YE (Email us for more codes)
Active Anti-Aging Eye Gel, Reduces Dark Circles, Puffy Eyes, Crow's Feet and Fine Lines & Wrinkles, Packed with Hyaluronic Acid & Age Defying Botanicals
AWS DAS-C01 Exam Prep on android
AWS DAS-C01 Exam Prep on Windows
The AWS Certified Data Analytics – Specialty (DAS-C01) covers the following domains:
Domain 1: Collection 18%
Domain 2: Storage and Data Management 22%
Domain 3: Processing 24%
Domain 4: Analysis and Visualization 18%
Domain 5: Security 18%
Below are the Top 100 AWS Certified Data Analytics – Specialty Questions and Answers Dumps and References –
Question1: What combination of services do you need for the following requirements: accelerate petabyte-scale data transfers, load streaming data, and the ability to create scalable, private connections. Select the correct answer order.
A) Snowball, Kinesis Firehose, Direct Connect
B) Data Migration Services, Kinesis Firehose, Direct Connect
C) Snowball, Data Migration Services, Direct Connect
D) Snowball, Direct Connection, Kinesis Firehose
ANSWER1:
Notes/Hint1:
Reference1: Big Data Analytics Options
AWS Data Analytics Specialty Certification Exam Preparation App is a great way to prepare for your upcoming AWS Data Analytics Specialty Certification Exam. The app provides you with over 300 questions and answers, detailed explanations of each answer, a scorecard to track your progress, and a countdown timer to help keep you on track. You can also find data science and data analytics interview questions and detailed answers, cheat sheets, and flashcards to help you study. The app is very similar to the real exam, so you will be well-prepared when it comes time to take the test.
![]()
![]()

ANSWER2:
Notes/Hint2:
Reference1: Relationalize PySpark
Unlock the Secrets of Africa: Master African History, Geography, Culture, People, Cuisine, Economics, Languages, Music, Wildlife, Football, Politics, Animals, Tourism, Science and Environment with the Top 1000 Africa Quiz and Trivia. Get Yours Now!
"Become a Canada Expert: Ace the Citizenship Test and Impress Everyone with Your Knowledge of Canadian History, Geography, Government, Culture, People, Languages, Travel, Wildlife, Hockey, Tourism, Sceneries, Arts, and Data Visualization. Get the Top 1000 Canada Quiz Now!"
Question 3: There is a five-day car rally race across Europe. The race coordinators are using a Kinesis stream and IoT sensors to monitor the movement of the cars. Each car has a sensor and data is getting back to the stream with the default stream settings. On the last day of the rally, data is sent to S3. When you go to interpret the data in S3, there is only data for the last day and nothing for the first 4 days. Which of the following is the most probable cause of this?
A) You did not have versioning enabled and would need to create individual buckets to prevent the data from being overwritten.
B) Data records are only accessible for a default of 24 hours from the time they are added to a stream.
C) One of the sensors failed, so there was no data to record.
D) You needed to use EMR to send the data to S3; Kinesis Streams are only compatible with DynamoDB.
ANSWER3:
Notes/Hint3:
Reference3: Kinesis Extended Reading
![]()
![]()
Question 4: A publisher website captures user activity and sends clickstream data to Amazon Kinesis Data Streams. The publisher wants to design a cost-effective solution to process the data to create a timeline of user activity within a session. The solution must be able to scale depending on the number of active sessions.
Which solution meets these requirements?
A) Include a variable in the clickstream data from the publisher website to maintain a counter for the number of active user sessions. Use a timestamp for the partition key for the stream. Configure the consumer application to read the data from the stream and change the number of processor threads based upon the counter. Deploy the consumer application on Amazon EC2 instances in an EC2 Auto Scaling group.
B) Include a variable in the clickstream to maintain a counter for each user action during their session. Use the action type as the partition key for the stream. Use the Kinesis Client Library (KCL) in the consumer application to retrieve the data from the stream and perform the processing. Configure the consumer application to read the data from the stream and change the number of processor threads based upon the
counter. Deploy the consumer application on AWS Lambda.
C) Include a session identifier in the clickstream data from the publisher website and use as the partition key for the stream. Use the Kinesis Client Library (KCL) in the consumer application to retrieve the data from the stream and perform the processing. Deploy the consumer application on Amazon EC2 instances in an
EC2 Auto Scaling group. Use an AWS Lambda function to reshard the stream based upon Amazon CloudWatch alarms.
D) Include a variable in the clickstream data from the publisher website to maintain a counter for the number of active user sessions. Use a timestamp for the partition key for the stream. Configure the consumer application to read the data from the stream and change the number of processor threads based upon the counter. Deploy the consumer application on AWS Lambda.
ANSWER4:
Notes/Hint4:
Reference4: UpdateShardCount API
Question 5: Your company has two batch processing applications that consume financial data about the day’s stock transactions. Each transaction needs to be stored durably and guarantee that a record of each application is delivered so the audit and billing batch processing applications can process the data. However, the two applications run separately and several hours apart and need access to the same transaction information. After reviewing the transaction information for the day, the information no longer needs to be stored. What is the best way to architect this application?
A) Use SQS for storing the transaction messages; when the billing batch process performs first and consumes the message, write the code in a way that does not remove the message after consumed, so it is available for the audit application several hours later. The audit application can consume the SQS message and remove it from the queue when completed.
B) Use Kinesis to store the transaction information. The billing application will consume data from the stream and the audit application can consume the same data several hours later.
C) Store the transaction information in a DynamoDB table. The billing application can read the rows while the audit application will read the rows then remove the data.
D) Use SQS for storing the transaction messages. When the billing batch process consumes each message, have the application create an identical message and place it in a different SQS for the audit application to use several hours later.
SQS would make this more difficult because the data does not need to persist after a full day.
ANSWER5:
Notes/Hint5:
Reference5: Amazon Kinesis
Get mobile friendly version of the quiz @ the App Store
AWS DAS-C01 Exam Prep on android
AWS DAS-C01 Exam Prep on Windows
Question 6: A company is currently using Amazon DynamoDB as the database for a user support application. The company is developing a new version of the application that will store a PDF file for each support case ranging in size from 1–10 MB. The file should be retrievable whenever the case is accessed in the application.
How can the company store the file in the MOST cost-effective manner?
A) Store the file in Amazon DocumentDB and the document ID as an attribute in the DynamoDB table.
B) Store the file in Amazon S3 and the object key as an attribute in the DynamoDB table.
C) Split the file into smaller parts and store the parts as multiple items in a separate DynamoDB table.
D) Store the file as an attribute in the DynamoDB table using Base64 encoding.
ANSWER6:
Notes/Hint6:
Reference6: S3 Storage Cost – DynamODB Storage Cost
Question 7: Your client has a web app that emits multiple events to Amazon Kinesis Streams for reporting purposes. Critical events need to be immediately captured before processing can continue, but informational events do not need to delay processing. What solution should your client use to record these types of events without unnecessarily slowing the application?
A) Log all events using the Kinesis Producer Library.
B) Log critical events using the Kinesis Producer Library, and log informational events using the PutRecords API method.
C) Log critical events using the PutRecords API method, and log informational events using the Kinesis Producer Library.
D) Log all events using the PutRecords API method.
ANSWER2:
Notes/Hint7:
Reference7: PutRecords API
![]()
![]()
Question 8: You work for a start-up that tracks commercial delivery trucks via GPS. You receive coordinates that are transmitted from each delivery truck once every 6 seconds. You need to process these coordinates in near real-time from multiple sources and load them into Elasticsearch without significant technical overhead to maintain. Which tool should you use to digest the data?
A) Amazon SQS
B) Amazon EMR
C) AWS Data Pipeline
D) Amazon Kinesis Firehose
ANSWER8:
Notes/Hint8:
Reference8: Amazon Kinesis Firehose
Question 9: A company needs to implement a near-real-time fraud prevention feature for its ecommerce site. User and order details need to be delivered to an Amazon SageMaker endpoint to flag suspected fraud. The amount of input data needed for the inference could be as much as 1.5 MB.
Which solution meets the requirements with the LOWEST overall latency?
A) Create an Amazon Managed Streaming for Kafka cluster and ingest the data for each order into a topic. Use a Kafka consumer running on Amazon EC2 instances to read these messages and invoke the Amazon SageMaker endpoint.
B) Create an Amazon Kinesis Data Streams stream and ingest the data for each order into the stream. Create an AWS Lambda function to read these messages and invoke the Amazon SageMaker endpoint.
C) Create an Amazon Kinesis Data Firehose delivery stream and ingest the data for each order into the stream. Configure Kinesis Data Firehose to deliver the data to an Amazon S3 bucket. Trigger an AWS Lambda function with an S3 event notification to read the data and invoke the Amazon SageMaker endpoint.
D) Create an Amazon SNS topic and publish the data for each order to the topic. Subscribe the Amazon SageMaker endpoint to the SNS topic.
ANSWER9:
Notes/Hint9:
Reference9: Amazon Managed Streaming for Kafka cluster
Question 10: You need to filter and transform incoming messages coming from a smart sensor you have connected with AWS. Once messages are received, you need to store them as time series data in DynamoDB. Which AWS service can you use?
A) IoT Device Shadow Service
B) Redshift
C) Kinesis
D) IoT Rules Engine
ANSWER10:
Notes/Hint10:
Reference10: The IoT rules engine
Get mobile friendly version of the quiz @ the App Store
Question 11: A media company is migrating its on-premises legacy Hadoop cluster with its associated data processing scripts and workflow to an Amazon EMR environment running the latest Hadoop release. The developers want to reuse the Java code that was written for data processing jobs for the on-premises cluster.
Which approach meets these requirements?
A) Deploy the existing Oracle Java Archive as a custom bootstrap action and run the job on the EMR cluster.
B) Compile the Java program for the desired Hadoop version and run it using a CUSTOM_JAR step on the EMR cluster.
C) Submit the Java program as an Apache Hive or Apache Spark step for the EMR cluster.
D) Use SSH to connect the master node of the EMR cluster and submit the Java program using the AWS CLI.
ANSWER11:
Notes/Hint11:
Reference11: Automating analytics workflows on EMR
Question 12: You currently have databases running on-site and in another data center off-site. What service allows you to consolidate to one database in Amazon?
A) AWS Kinesis
B) AWS Database Migration Service
C) AWS Data Pipeline
D) AWS RDS Aurora
ANSWER12:
Notes/Hint12:
Reference12: DMS
Question 13: An online retail company wants to perform analytics on data in large Amazon S3 objects using Amazon EMR. An Apache Spark job repeatedly queries the same data to populate an analytics dashboard. The analytics team wants to minimize the time to load the data and create the dashboard.
Which approaches could improve the performance? (Select TWO.)
A) Copy the source data into Amazon Redshift and rewrite the Apache Spark code to create analytical reports by querying Amazon Redshift.
B) Copy the source data from Amazon S3 into Hadoop Distributed File System (HDFS) using s3distcp.
C) Load the data into Spark DataFrames.
D) Stream the data into Amazon Kinesis and use the Kinesis Connector Library (KCL) in multiple Spark jobs to perform analytical jobs.
E) Use Amazon S3 Select to retrieve the data necessary for the dashboards from the S3 objects.
ANSWER13:
Notes/Hint13:
Reference13: Spark DataFrames
Question 14: You have been hired as a consultant to provide a solution to integrate a client’s on-premises data center to AWS. The customer requires a 300 Mbps dedicated, private connection to their VPC. Which AWS tool do you need?
A) VPC peering
B) Data Pipeline
C) Direct Connect
D) EMR
ANSWER14:
Notes/Hint14:
Reference14: Direct Connect
![]()
![]()
Question 15: Your organization has a variety of different services deployed on EC2 and needs to efficiently send application logs over to a central system for processing and analysis. They’ve determined it is best to use a managed AWS service to transfer their data from the EC2 instances into Amazon S3 and they’ve decided to use a solution that will do what?
A) Installs the AWS Direct Connect client on all EC2 instances and uses it to stream the data directly to S3.
B) Leverages the Kinesis Agent to send data to Kinesis Data Streams and output that data in S3.
C) Ingests the data directly from S3 by configuring regular Amazon Snowball transactions.
D) Leverages the Kinesis Agent to send data to Kinesis Firehose and output that data in S3.
ANSWER15:
Notes/Hint15:
Reference15: Kinesis Firehose
Question 16: A data engineer needs to create a dashboard to display social media trends during the last hour of a large company event. The dashboard needs to display the associated metrics with a latency of less than 1 minute.
Which solution meets these requirements?
A) Publish the raw social media data to an Amazon Kinesis Data Firehose delivery stream. Use Kinesis Data Analytics for SQL Applications to perform a sliding window analysis to compute the metrics and output the results to a Kinesis Data Streams data stream. Configure an AWS Lambda function to save the stream data to an Amazon DynamoDB table. Deploy a real-time dashboard hosted in an Amazon S3 bucket to read and display the metrics data stored in the DynamoDB table.
B) Publish the raw social media data to an Amazon Kinesis Data Firehose delivery stream. Configure the stream to deliver the data to an Amazon Elasticsearch Service cluster with a buffer interval of 0 seconds. Use Kibana to perform the analysis and display the results.
C) Publish the raw social media data to an Amazon Kinesis Data Streams data stream. Configure an AWS Lambda function to compute the metrics on the stream data and save the results in an Amazon S3 bucket. Configure a dashboard in Amazon QuickSight to query the data using Amazon Athena and display the results.
D) Publish the raw social media data to an Amazon SNS topic. Subscribe an Amazon SQS queue to the topic. Configure Amazon EC2 instances as workers to poll the queue, compute the metrics, and save the results to an Amazon Aurora MySQL database. Configure a dashboard in Amazon QuickSight to query the data in Aurora and display the results.
ANSWER16:
Notes/Hint16:
Reference16: Amazon Kinesis Data Analytics can query data in a Kinesis Data Firehose delivery stream in near-real time using SQL
Question 17: A real estate company is receiving new property listing data from its agents through .csv files every day and storing these files in Amazon S3. The data analytics team created an Amazon QuickSight visualization report that uses a dataset imported from the S3 files. The data analytics team wants the visualization report to reflect the current data up to the previous day. How can a data analyst meet these requirements?
A) Schedule an AWS Lambda function to drop and re-create the dataset daily.
B) Configure the visualization to query the data in Amazon S3 directly without loading the data into SPICE.
C) Schedule the dataset to refresh daily.
D) Close and open the Amazon QuickSight visualization.
ANSWER17:
Notes/Hint17:
Reference17: Amazon QuickSight and SPICE
![]()
![]()
Question 18: You need to migrate data to AWS. It is estimated that the data transfer will take over a month via the current AWS Direct Connect connection your company has set up. Which AWS tool should you use?
A) Establish additional Direct Connect connections.
B) Use Data Pipeline to migrate the data in bulk to S3.
C) Use Kinesis Firehose to stream all new and existing data into S3.
D) Snowball
ANSWER18:
Notes/Hint18:
Reference18: Snowball
Question 19: You currently have an on-premises Oracle database and have decided to leverage AWS and use Aurora. You need to do this as quickly as possible. How do you achieve this?
A) It is not possible to migrate an on-premises database to AWS at this time.
B) Use AWS Data Pipeline to create a target database, migrate the database schema, set up the data replication process, initiate the full load and a subsequent change data capture and apply, and conclude with a switchover of your production environment to the new database once the target database is caught up with the source database.
C) Use AWS Database Migration Services and create a target database, migrate the database schema, set up the data replication process, initiate the full load and a subsequent change data capture and apply, and conclude with a switch-over of your production environment to the new database once the target database is caught up with the source database.
D) Use AWS Glue to crawl the on-premises database schemas and then migrate them into AWS with Data Pipeline jobs.
https://aws.amazon.com/dms/
ANSWER19:
Notes/Hint19:
Reference19: DMS
Question 20: A financial company uses Amazon EMR for its analytics workloads. During the company’s annual security audit, the security team determined that none of the EMR clusters’ root volumes are encrypted. The security team recommends the company encrypt its EMR clusters’ root volume as soon as possible.
Which solution would meet these requirements?
A) Enable at-rest encryption for EMR File System (EMRFS) data in Amazon S3 in a security configuration. Re-create the cluster using the newly created security configuration.
B) Specify local disk encryption in a security configuration. Re-create the cluster using the newly created security configuration.
C) Detach the Amazon EBS volumes from the master node. Encrypt the EBS volume and attach it back to the master node.
D) Re-create the EMR cluster with LZO encryption enabled on all volumes.
ANSWER20:
Notes/Hint20:
Reference20: EMR Cluster Local disk encryption
Question 21: A company has a clickstream analytics solution using Amazon Elasticsearch Service. The solution ingests 2 TB of data from Amazon Kinesis Data Firehose and stores the latest data collected within 24 hours in an Amazon ES cluster. The cluster is running on a single index that has 12 data nodes and 3 dedicated master nodes. The cluster is configured with 3,000 shards and each node has 3 TB of EBS storage attached. The Data Analyst noticed that the query performance of Elasticsearch is sluggish, and some intermittent errors are produced by the Kinesis Data Firehose when it tries to write to the index. Upon further investigation, there were occasional JVMMemoryPressure errors found in Amazon ES logs.
What should be done to improve the performance of the Amazon Elasticsearch Service cluster?
Question 22: A data lake is a central repository that enables which operation?
Question 23: What is the most cost-effective storage option for your data lake?
Question 24: Which services are used in the processing layer of a data lake architecture? (SELECT TWO)
Question 25: Which services can be used for data ingestion into your data lake? (SELECT TWO)
A) Amazon Kinesis Data Firehose
B) Amazon QuickSight
C) Amazon Athena
D) AWS Storage Gateway
Question 26: Which service uses continuous data replication with high availability to consolidate databases into a petabyte-scale data warehouse by streaming data to amazon Redshift and Amazon S3?
A) AWS Storage Gateway
B) AWS Schema Conversion Tool
C) AWS Database Migration Service
D) Amazon Kinesis Data Firehose
Question 27: What is the AWS Glue Data Catalog?
A) A fully managed ETL (extract, transform, and load) pipeline service
B) A service to schedule jobs
C) A visual data preparation tool
D) An index to the location, schema, and runtime metrics of your data
Questions 28: What AWS Glue feature “catalogs” your data?
A) AWS Glue crawler
B) AWS Glue DataBrew
C) AWS Glue Studio
D) AWS Glue Elastic Views
Question 29: During your data preparation stage, the raw data has been enriched to support additional insights. You need to improve query performance and reduce costs of the final analytics solution.
Which data formats meet these requirements (SELECT TWO)
Question 30: Your small start-uo company is developing a data analytics solution. You need to clean and normalize large datasets, but you do not have developers with the skill set to write custom scripts. Which tool will help efficiently design and run the data preparation activities?
Question 30: In which scenario would you use AWS Glue jobs?
A) Analyze data in real-time as data comes into the data lake
B) Transform data in real-time as data comes into the data lake
C) Analyze data in batches on schedule or on demand
D) Transform data in batches on schedule or on demand.
Question 31: Your data resides in multiple data stores, including Amazon S3, Amazon RDS, and Amazon DynamoDB. You need to efficiently query the combined datasets.
Which tool can achieve this, using a single query, without moving data?
A) Amazon Athena Federated Query
B) Amazon Redshift Query Editor
C) SQl Workbench
D) AWS Glue DataBrew
Question 32: Which benefit do you achieve by using AWS Lake Formation to build data lakes?
A) Build data lakes quickly
B) Simplify security management
C) Provide self-service access to data
D) All of the above
Question 33: What are the three stages to set up a data lake using AWS Lake Formation? (SELECT THREE)
Question 35: A digital media customer needs to quickly build a data lake solution for the data housed in a PostgreSQL database. As a solutions architect, what service and feature would meet this requirement?
Question 36: AWS Lake Formation has a set of suggested personas and IAM permissions. Which is a required persona?
Question 37: Which three types of blueprints does AWS Lake Formation support? (SELECT THREE)
Question 38: Which one of the following is the best description of the capabilities of Amazon QuickSight?
Question 39: Which benefits are provided by Amazon Redshift? (Select TWO)
A) Analyze Data stored in your data lake
B) Maintain performance at scale
C) Focus effort on Data warehouse administration
D) Store all the data to meet analytics need
E) Amazon Redshift includes enterprise-level security and compliance features.
Djamga Data Sciences Big Data – Data Analytics Youtube Playlist
2- Prepare for Your AWS Certification Exam
3- LinuxAcademy
Big Data – Data Analytics Jobs:
Big Data – Data Analytics – Data Sciences Latest News:
DATA ANALYTICS Q&A:
[/bg_collapse]
Clever Questions, Answers, Resources about:
- Data Sciences
- Big Data
- Data Analytics
- Data Sciences
- Databases
- Data Streams
- Large DataSets
What Is a Data Scientist?
Data Scientist (n.): Person who is better at statistics than any software engineer and better at software engineering than any statistician. – Josh Wills
Data scientists apply sophisticated quantitative and computer science skills to both structure and analyze massive stores or continuous streams of unstructured data, with the intent to derive insights and prescribe action. – Burtch Works Data Science Salary Survey, May 2018
More than anything, what data scientists do is make discoveries while swimming in data… In a competitive landscape where challenges keep changing and data never stop flowing, data scientists help decision makers shift from ad hoc analysis to an ongoing conversation with data. – Data Scientist: The Sexiest Job of the 21st Century, Harvard Business Review
Do All Data Scientists Hold Graduate Degrees?
Data scientists are highly educated. With exceedingly rare exception, every data scientist holds at least an undergraduate degree. 91% of data scientists in 2018 held advanced degrees. The remaining 9% all held undergraduate degrees. Furthermore,
- 25% of data scientists hold a degree in statistics or mathematics,
- 20% have a computer science degree,
- an additional 20% hold a degree in the natural sciences, and
- 18% hold an engineering degree.
The remaining 17% of surveyed data scientists held degrees in business, social science, or economics.
How Are Data Scientists Different From Data Analysts?
Broadly speaking, the roles differ in scope: data analysts build reports with narrow, well-defined KPIs. Data scientists often to work on broader business problems without clear solutions. Data scientists live on the edge of the known and unknown.
We’ll leave you with a concrete example: A data analyst cares about profit margins. A data scientist at the same company cares about market share.
How Is Data Science Used in Medicine?
Data science in healthcare best translates to biostatistics. It can be quite different from data science in other industries as it usually focuses on small samples with several confounding variables.
How Is Data Science Used in Manufacturing?
Data science in manufacturing is vast; it includes everything from supply chain optimization to the assembly line.
What are data scientists paid?
Most people are attracted to data science for the salary. It’s true that data scientists garner high salaries compares to their peers. There is data to support this: The May 2018 edition of the BurtchWorks Data Science Salary Survey, annual salary statistics were
Note the above numbers do not reflect total compensation which often includes standard benefits and may include company ownership at high levels.
How will data science evolve in the next 5 years?
Will AI replace data scientists?
What is the workday like for a data scientist?
It’s common for data scientists across the US to work 40 hours weekly. While company culture does dictate different levels of work life balance, it’s rare to see data scientists who work more than they want. That’s the virtue of being an expensive resource in a competitive job market.
How do I become a Data Scientist?
The roadmap given to aspiring data scientists can be boiled down to three steps:
- Earning an undergraduate and/or advanced degree in computer science, statistics, or mathematics,
- Building their portfolio of SQL, Python, and R skills, and
- Getting related work experience through technical internships.
All three require a significant time and financial commitment.
There used to be a saying around datascience: The road into a data science starts with two years of university-level math.
What Should I Learn? What Order Do I Learn Them?
This answer assumes your academic background ends with a HS diploma in the US.
- Python
- Differential Calculus
- Integral Calculus
- Multivariable Calculus
- Linear Algebra
- Probability
- Statistics
Some follow up questions and answers:
Why Python first?
- Python is a general purpose language. R is used primarily by statisticians. In the likely scenario that you decide data science requires too much time, effort, and money, Python will be more valuable than your R skills. It’s preparing you to fail, sure, but in the same way a savings account is preparing you to fail.
When do I start working with data?
- You’ll start working with data when you’ve learned enough Python to do so. Whether you’ll have the tools to have any fun is a much more open-ended question.
How long will this take me?
- Assuming self-study and average intelligence, 3-5 years from start to finish.
How Do I Learn Python?
If you don’t know the first thing about programming, start with MIT’s course in the curated list.
These modules are the standard tools for data analysis in Python:
pandas(and by extension,numpy)Check out Minimally Sufficient Pandas for style guides and best practices.matplotlibandseabornSee /u/rhiever’s response to How do you decide between the plotting libraries: Matplotlib, Seaborn, Bokeh?Don’t worry about bokeh or dash unless you have a personal interest in interactive visualizations.scipyandscikit-learnInternalize the.fit()and.predict()pattern.
Curated Threads & Resources
- MIT’s Introduction to Computer Science and Programming in Python A free, archived course taught at MIT in the fall 2016 semester.
- Data Scientist with Python Career Track | DataCamp The first courses are free, but unlimited access costs $29/month. Users usually report a positive experience, and it’s one of the better hands-on ways to learn Python.
- Sentdex’s (Harrison Kinsley) Youtube Channel Related to Python Programming Tutorials
- /r/learnpython is an active sub and very useful for learning the basics.
How Do I Learn R?
If you don’t know the first thing about programming, start with R for Data Science in the curated list.
These modules are the standard tools for data analysis in Python:
Curated Threads & Resources
- R for Data Science by Hadley WickhamA free ebook full of succinct code examples. Terrific for learning tidyverse syntax.Folks with some math background may prefer the free alternative, Introduction to Statistical Learning.
- Data Scientist with R Career Track | DataCamp The first courses are free, but unlimited access costs $29/month. Users usually report a positive experience, and it’s one of the few hands-on ways to learn R.
- R Inferno Learners with a CS background will appreciate this free handbook explaining how and why R behaves the way that it does.
How Do I Learn SQL?
Prioritize the basics of SQL. i.e. when to use functions like POW, SUM, RANK; the computational complexity of the different kinds of joins.
Concepts like relational algebra, when to use clustered/non-clustered indexes, etc. are useful, but (almost) never come up in interviews.
You absolutely do not need to understand administrative concepts like managing permissions.
Finally, there are numerous query engines and therefore numerous dialects of SQL. Use whichever dialect is supported in your chosen resource. There’s not much difference between them, so it’s easy to learn another dialect after you’ve learned one.
Curated Threads & Resources
- The SQL Tutorial for Data Analysis | Mode.com
- Introduction to Databases A Free MOOC supported by Stanford University.
- SQL Queries for Mere MortalsA $30 book highly recommended by /u/karmanujan
How Do I Learn Calculus?
Fortunately (or unfortunately), calculus is the lament of many students, and so resources for it are plentiful. Khan Academy mimics lectures very well, and Paul’s Online Math Notes are a terrific reference full of practice problems and solutions.
Calculus, however, is not just calculus. For those unfamiliar with US terminology,
- Calculus I is differential calculus.
- Calculus II is integral calculus.
- Calculus III is multivariable calculus.
- Calculus IV is differential equations.
Differential and integral calculus are both necessary for probability and statistics, and should be completed first.
Multivariable calculus can be paired with linear algebra, but is also required.
Differential equations is where consensus falls apart. The short it is, they’re all but necessary for mathematical modeling, but not everyone does mathematical modeling. It’s another tool in the toolbox.
Curated Threads & Resources about Data Science and Data Analytics
- Khan AcademyDifferential CalculusIntegral CalculusMultivariable CalculusDifferential Equations
- Paul’s Online Math NotesDifferential CalculusIntegral CalculusMultivariable Calculus
How Do I Learn Probability?
Probability is not friendly to beginners. Definitions are rooted in higher mathematics, notation varies from source to source, and solutions are frequently unintuitive. Probability may present the biggest barrier to entry in data science.
It’s best to pick a single primary source and a community for help. If you can spend the money, register for a university or community college course and attend in person.
The best free resource is MIT’s 18.05 Introduction to Probability and Statistics (Spring 2014). Leverage /r/learnmath, /r/learnmachinelearning, and /r/AskStatistics when you get inevitably stuck.
How Do I Learn Linear Algebra?
Curated Threads & Resources https://www.youtube.com/watch?v=fNk_zzaMoSs&index=1&list=PLZHQObOWTQDPD3MizzM2xVFitgF8hE_ab
What does the typical data science interview process look like?
For general advice, Mastering the DS Interview Loop is a terrific article. The community discussed the article here.
Briefly summarized, most companies follow a five stage process:
- Coding Challenge: Most common at software companies and roles contributing to a digital product.
- HR Screen
- Technical Screen: Often in the form of a project. Less frequently, it takes the form of a whiteboarding session at the onsite.
- Onsite: Usually the project from the technical screen is presented here, followed by a meeting with the director overseeing the team you’ll join.
- Negotiation & Offer
Preparation:
- Practice questions on Leetcode which has both SQL and traditional data structures/algorithm questions
- Review Brilliant for math and statistics questions.
- SQL Zoo and Mode Analytics both offer various SQL exercises you can solve in your browser.
Tips:
- Before you start coding, read through all the questions. This allows your unconscious mind to start working on problems in the background.
- Start with the hardest problem first, when you hit a snag, move to the simpler problem before returning to the harder one.
- Focus on passing all the test cases first, then worry about improving complexity and readability.
- If you’re done and have a few minutes left, go get a drink and try to clear your head. Read through your solutions one last time, then submit.
- It’s okay to not finish a coding challenge. Sometimes companies will create unreasonably tedious coding challenges with one-week time limits that require 5–10 hours to complete. Unless you’re desperate, you can always walk away and spend your time preparing for the next interview.
Remember, interviewing is a skill that can be learned, just like anything else. Hopefully, this article has given you some insight on what to expect in a data science interview loop.
The process also isn’t perfect and there will be times that you fail to impress an interviewer because you don’t possess some obscure piece of knowledge. However, with repeated persistence and adequate preparation, you’ll be able to land a data science job in no time!
What does the Airbnb data science interview process look like? [Coming soon]
What does the Facebook data science interview process look like? [Coming soon]
What does the Uber data science interview process look like? [Coming soon]
What does the Microsoft data science interview process look like? [Coming soon]
What does the Google data science interview process look like? [Coming soon]
What does the Netflix data science interview process look like? [Coming soon]
What does the Apple data science interview process look like? [Coming soon]
Question: How is SQL used in real data science jobs?
Real life enterprise databases are orders of magnitude more complex than the “customers, products, orders” examples used as teaching tools. SQL as a language is actually, IMO, a relatively simple language (the db administration component can get complex, but mostly data scientists aren’t doing that anyways). SQL is an incredibly important skill though for any DS role. I think when people emphasize SQL, what they really are talking about is the ability to write queries that interrogate the data and discover the nuances behind how it is collected and/or manipulated by an application before it is written to the dB. For example, is the employee’s phone number their current phone number or does the database store a history of all previous phone numbers? Critically important questions for understanding the nature of your data, and it doesn’t necessarily deal with statistics! The level of syntax required to do this is not that sophisticated, you can get pretty damn far with knowledge of all the joins, group by/analytical functions, filtering and nesting queries. In many cases, the data is too large to just select * and dump into a csv to load into pandas, so you start with SQL against the source. In my mind it’s more important for “SQL skills” to know how to generate hypotheses (that will build up to answering your business question) that can be investigated via a query than it is to be a master of SQL’s syntax. Just my two cents though!
AWS DAS-C01 Exam Prep on android
AWS DAS-C01 Exam Prep on Windows
Data Visualization example: 12000 Years of Human Population Dynamic
[OC] 12,000 years of human population dynamics from dataisbeautiful
Human population density estimates based on the Hyde 3.2 model.
Data visualization example: AirPods Revenue vs. Top Tech Companies
[OC] AirPods Revenue vs. Top Tech Companies from dataisbeautiful
Source: 24/7 Kevin Rooke, Google Search, SEC Edgar
Data visualization example: Crypto race: DOGE (red) versus BTC (blue), 5/6/2020 – 5/5/2021
[OC] Crypto race: DOGE (red) versus BTC (blue), 5/6/2020 – 5/5/2021 from dataisbeautiful
Data sources: Coindesk-Bitcoin ; Coindesk-Dodgecoin
[OC] How have cryptocurrencies done during the Pandemic? from dataisbeautiful
Data source: Performance data on these cryptocurrencies from Investing.com which provides free historic data
Data visualization example: Countries with the Most Nuclear Warheads
[OC] Countries with the Most Nuclear Warheads from dataisbeautiful
Data Source: Here
![]()
![]()
AWS Data Analytics Specialty Certification DAS-C01 Exam Prep on iOS
Capitol insurrection arrests per million people by state
[OC] Capitol insurrection arrests per million people by state from dataisbeautiful
Data Source: Made in Google Sheets using data from this USA Today article (for the number of arrests by arrestee’s home state) and this spreadsheet of the results of the 2020 Census (for the population of each state and DC in 2020, which was used as the denominator in calculating arrests/million people).
![]()
![]()
Basic Data Lake Architecture

Data Analytics Architecture on AWS

Data Analytics Process

AWS Data Analytics Specialty Certification DAS-C01 Exam Prep on iOS
AWS DAS-C01 Exam Prep on android
AWS DAS-C01 Exam Prep on Windows
Data Lake Storage:

AWS DAS-C01 Exam Prep on android
AWS DAS-C01 Exam Prep on Windows
Event Driven Data Analytics Workflow on AWS

What is a Data Lake?

What is a Data Warehouse?

What are benefits of a data warehouse?
• Informed decision making
• Consolidated data from many sources
• Historical data analysis
• Data quality, consistency, and accuracy
• Separation of analytics processing from transactional databases
AWS Data Analytics Specialty Certification DAS-C01 Exam Prep on iOS
AWS DAS-C01 Exam Prep on android
AWS DAS-C01 Exam Prep on Windows
Data Lake vs Data Warehouse – Comparison

A data warehouse is specially designed for data analytics, which identifies relationships and trends across large amounts of data. A database is used to capture and store data, such as the details of a transaction. Unlike a data warehouse, a data lake is a centralized repository for structured, semi-structured, and unstructured data. A data warehouse organizes data in a tabular format (or schema) that enables SQL queries on the data. But not all applications require data to be in tabular format. Some applications can access data in the data lake even if it is “semi-structured” or unstructured. These include big data analytics, full-text search, and machine learning.
An AWS data lake only has a storage charge for the data. No servers are necessary for the data to be stored and accessed. In the case of Amazon Athena, also, there are no additional charges for processing. Data warehouse enable fast queries of structured data from transactional systems for batch reports, business intelligence, and visualization use cases. A data lake stores data without regard to its structure. Data scientists, data analysts, and business analysts use the data lake. They support use cases such as machine learning, predictive analytics, and data discovery and profiling.
Transactional Data Ingestion

AWS Data Analytics Specialty Certification DAS-C01 Exam Prep on iOS
AWS DAS-C01 Exam Prep on android
AWS DAS-C01 Exam Prep on Windows

Structured Query Language (SQL)

Data definition language (DDL) refers to the subset of SQL commands that define data structures and objects such as databases, tables, and views. DDL commands include the following:
• CREATE: used to create a new object.
• DROP: used to delete an object.
• ALTER: used to modify an object.
• RENAME: used to rename an object.
• TRUNCATE: used to remove all rows from a table without deleting the table itself.
AWS Data Analytics Specialty Certification DAS-C01 Exam Prep on iOS
AWS DAS-C01 Exam Prep on android
AWS DAS-C01 Exam Prep on Windows
Data manipulation language (DML) refers to the subset of SQL commands that are used to work with data. DML commands include the following:
• SELECT: used to request records from one or more tables.
• INSERT: used to insert one or more records into a table.
• UPDATE: used to modify the data of one or more records in a table.
• DELETE: used to delete one or more records from a table.
• EXPLAIN: used to analyze and display the expected execution plan of a SQL statement.
• LOCK: used to lock a table from write operations (INSERT, UPDATE, DELETE) and prevent concurrent operations from conflicting with one another.
Data control language (DCL) refers to the subset of SQL commands that are used to configure permissions to objects. DCL commands include:
• GRANT: used to grant access and permissions to a database or object in a database, such as a schema or table.
• REVOKE: used to remove access and permissions from a database or objects in a database.
AWS Data Analytics Specialty Certification DAS-C01 Exam Prep on iOS
AWS DAS-C01 Exam Prep on android
AWS DAS-C01 Exam Prep on Windows
Comparison of OLTP and OLAP

AWS Data Analytics Specialty Certification DAS-C01 Exam Prep on iOS
AWS DAS-C01 Exam Prep on android
AWS DAS-C01 Exam Prep on Windows
What is Amazon Macie?

Businesses are responsible to identify and limit disclosure of sensitive data such as personally identifiable information (PII) or proprietary information. Identifying and masking sensitive information is time consuming, and becomes more complex in data lakes with various data sources and formats and broad user access to published data sets.
Amazon Macie is a fully managed data security and privacy service that uses machine learning and pattern matching to discover sensitive data in AWS. Macie includes a set of managed data identifiers which automatically detect common types of sensitive data. Examples of managed data identifiers include keywords, credentials, financial information, health information, and PII. You can also configure custom data identifiers using keywords or regular expressions to highlight organizational proprietary data, intellectual property, and other specific scenarios. You can develop security controls that operate at scale to monitor and remediate risk automatically when Macie detects sensitive data. You can use AWS Lambda functions to automatically turn on encryption for an Amazon S3 bucket where Macie detects sensitive data. Or automatically tag datasets containing sensitive data, for inclusion in orchestrated data transformations or audit reports.
Amazon Macie can be integrated into the data ingestion and processing steps of your data pipeline. This approach avoids inadvertent disclosures in published data sets by detecting and addressing the sensitive data as it is ingested and processed. Building the automated detection and processing of sensitive data into your ETL pipelines simplifies and standardizes handling of sensitive data at scale.
AWS Data Analytics Specialty Certification DAS-C01 Exam Prep on iOS
AWS DAS-C01 Exam Prep on android
AWS DAS-C01 Exam Prep on Windows
What is AWS Glue DataBrew?

AWS Glue DataBrew is a visual data preparation tool that simplifies cleaning and normalizing datasets in preparation for use in analytics and machine learning.
• Profile data quality, identifying patterns and automatically detecting anomalies.
• Clean and normalize data using over 250 pre-built transformations, without writing code.
• Visually map the lineage of your data to understand data sources and transformation history.
• Save data cleaning and normalization workflows for automatic application to new data.
Data processed in AWS Glue DataBrew is immediately available for use in analytics and machine learning projects.
Learn more about the built-in transformations available in AWS Glue DataBrew in the Recipe actions reference: https://docs.aws.amazon.com/databrew/latest/dg/recipe-actions-reference.html
AWS Data Analytics Specialty Certification DAS-C01 Exam Prep on iOS
AWS DAS-C01 Exam Prep on android
AWS DAS-C01 Exam Prep on Windows
What is AWS Glue?

AWS Glue is a fully managed ETL (extract, transform, and load) service that makes it simple and cost-effective to categorize your data, clean it, enrich it, and move it reliably between various data stores and data streams. AWS Glue consists of a central metadata repository known as the AWS Glue Data Catalog, an ETL engine that automatically generates Python or Scala code, and a flexible scheduler that handles dependency resolution, job monitoring, and retries. AWS Glue can run your ETL jobs as new data arrives. For example, you can use an AWS Lambda function to trigger your ETL jobs to run as soon as new data becomes available in Amazon S3. You can also register this new dataset in the
AWS Glue Data Catalog as part of your ETL jobs.
AWS Glue is serverless, so there’s no infrastructure to set up or manage.
AWS Data Analytics Specialty Certification DAS-C01 Exam Prep on iOS
AWS DAS-C01 Exam Prep on android
AWS DAS-C01 Exam Prep on Windows
AWS Glue Data Catalog The AWS Glue Data Catalog provides a uniform repository where disparate systems can store and find metadata to keep track of data in data silos, and use that metadata to query and transform the data. Once the data is cataloged, it is immediately available for search and query using Amazon Athena, Amazon EMR, and Amazon Redshift Spectrum.
You can use AWS Identity and Access Management (IAM) policies to control access to the data sources managed by the AWS Glue Data Catalog. The Data Catalog also provides comprehensive audit and governance capabilities, with schema-change tracking and data access controls.
AWS Glue crawler
AWS Glue crawlers can scan data in all kinds of repositories, classify it, extract schema information from it, and store the metadata automatically in the AWS Glue Data Catalog.
AWS Glue ETL
AWS Glue can run your ETL jobs as new data arrives. For example, you can use an AWS Lambda function to trigger your ETL jobs to run as soon as new data becomes available in Amazon S3. You can also register this new dataset in the AWS Glue Data Catalog as part of your ETL jobs.
AWS Glue Studio
AWS Glue Studio provides a graphical interface to create, run, and monitor extract, transform, and load (ETL) jobs in AWS Glue. You can visually compose data transformation workflows and seamlessly run them on AWS Glue’s Apache Spark-based serverless ETL engine. AWS Glue Studio also offers tools to monitor ETL workflows and validate that they are operating as intended.
AWS Data Analytics Specialty Certification DAS-C01 Exam Prep on iOS
AWS DAS-C01 Exam Prep on android
AWS DAS-C01 Exam Prep on Windows
What is Amazon Athena?

Amazon Athena is an interactive query service that makes it easy to analyze data in Amazon S3 using standard SQL. Athena is serverless, so there is no infrastructure to set up or manage, and you can start analyzing data immediately. You don’t even need to load your data into Athena, it works directly with data stored in S3. To get started, just log into the Amazon Athena console, define your schema, and start querying. Athena uses Presto with full standard SQL support. It works with a variety of standard data formats, including CSV, JSON, ORC, Apache Parquet and Avro. While Athena is ideal for quick, ad-hoc querying, it can also handle complex analysis, including large joins, window functions, and arrays.
Amazon Athena helps you analyze data stored in Amazon S3. You can use Athena to run ad-hoc queries using ANSI SQL, without the need to aggregate or load the data into Athena. It can process unstructured, semi-structured, and structured datasets. Examples include CSV, JSON, Avro or columnar data formats such as Apache Parquet and Apache ORC. Athena integrates with Amazon QuickSight for easy visualization. You can also use Athena to generate reports or to explore data with business intelligence tools or SQL clients, connected via an ODBC or JDBC driver.
The tables and databases that you work with in Athena to run queries are based on metadata. Metadata is data about the underlying data in your dataset. How that metadata describes your dataset is called the schema. For example, a table name, the column names in the table, and the data type of each column are schema, saved as metadata, that describe an underlying dataset. In Athena, we call a system for organizing metadata a data catalog or a metastore. The combination of a dataset and the data catalog that describes it is called a data source.
The relationship of metadata to an underlying dataset depends on the type of data source that you work with. Relational data sources like MySQL, PostgreSQL, and SQL Server tightly integrate the metadata with the dataset. In these systems, the metadata is most often written when the data is written. Other data sources, like those built using Hive, allow you to define metadata on-the-fly when you read the dataset. The dataset can be in a variety of formats; for example, CSV, JSON, Parquet, or Avro.
AWS Data Analytics Specialty Certification DAS-C01 Exam Prep on iOS
AWS DAS-C01 Exam Prep on android
AWS DAS-C01 Exam Prep on Windows
What is AWS Lake Formation?

Lake Formation is a fully managed service that enables data engineers, security officers, and data analysts to build, secure, manage, and use your data lake
To build your data lake in AWS Lake Formation, you must register an Amazon S3 location as a data lake. The Lake Formation service must have permission to write to the AWS Glue Data Catalog and to Amazon S3 locations in the data lake.
Next, identify the data sources to be ingested. AWS Lake formation can move data into your data lake from existing Amazon S3 data stores. Lake Formation can collect and organize datasets, such as logs from AWS CloudTrail, AWS CloudFront, detailed billing reports, or Elastic Load Balancing. You can ingest bulk or incremental datasets from relational, NoSQL, or non-relational databases. Lake Formation can ingest data from databases running in Amazon RDS or hosted in Amazon EC2. You can also ingest data from on-premises databases using Java Database Connectivity JDBC connectors. You can use custom AWS Glue jobs to load data from other databases or to ingest streaming data using Amazon Kinesis or Amazon DynamoDB.
AWS Lake Formation manages AWS Glue crawlers, AWS Glue ETL jobs, the AWS Glue Data Catalog, security settings, and access control:
• Lake Formation is an automated build environment based on AWS Glue.
• Lake Formation coordinates AWS Glue crawlers to identify datasets within the specified data stores and collect metadata for each dataset
• Lake Formation can perform transformations on your data, such as rewriting and organizing data into a consistent, analytics-friendly format. Lake Formation creates transformation templates and schedules AWS Glue jobs to prepare and optimize your data for analytics. Lake Formation also helps clean your data using FindMatches, an ML-based deduplication transform. AWS Glue jobs encapsulate scripts, such as ETL scripts, which connect to source data, process it, and write it out to a data target. AWS Glue triggers can start jobs based on a schedule or event, or on demand. AWS Glue workflows orchestrate AWS ETL jobs, crawlers, and triggers. You can define a workflow manually or use a blueprint based on commonly ingested data source types.
• The AWS Glue Data Catalog within the data lake persistently stores the metadata from raw and processed datasets. Metadata about data sources and targets is in the form of databases and tables. Tables store information about the underlying data, including schema information, partition information, and data location. Databases are collections of tables. Each AWS account has one data catalog per AWS Region.
• Lake Formation provides centralized access controls for your data lake, including security policy-based rules for users and applications by role. You can authenticate the users and roles using AWS IAM. Once the rules are defined, Lake Formation enforces them with table-and column-level granularity for users of Amazon Redshift Spectrum and Amazon Athena. Rules are enforced at the table-level in AWS Glue, which is normally accessed for administrators.
• Lake Formation leverages the encryption capabilities of Amazon S3 for data in the data lake. This approach provides automatic server-side encryption with keys managed by the AWS Key Management Service (KMS). S3 encrypts data in transit when replicating across Regions. You can separate accounts for source and destination Regions to further protect your data
AWS Data Analytics Specialty Certification DAS-C01 Exam Prep on iOS
AWS DAS-C01 Exam Prep on android
AWS DAS-C01 Exam Prep on Windows
What is Amazon Quicksight?
Amazon QuickSight is a cloud-scale business intelligence (BI) service. In a single data dashboard, QuickSight gives decision-makers the opportunity to explore and interpret information in an interactive visual environment. QuickSight can include AWS data, third-party data, big data, spreadsheet data, SaaS data, B2B data, and more. QuickSight delivers fast and responsive query performance by using a robust in-memory engine (SPICE).
Scale from tens to tens of thousands of users
Amazon QuickSight has a serverless architecture that automatically scales to tens of thousands of users without the need to setup, configure, or manage your own servers.
Embed BI dashboards in your applications
With QuickSight, you can quickly embed interactive dashboards into your applications, websites, and portals.
Access deeper insights with Machine Learning
QuickSight leverages the proven machine learning (ML) capabilities of AWS. BI teams can perform advanced analytics without prior data science experience.
Ask questions of your data, receive answers
With QuickSight, you can quickly get answers to business questions asked in natural language with QuickSight’s new ML-powered natural language query capability, Q.
AWS Data Analytics Specialty Certification DAS-C01 Exam Prep on iOS
AWS DAS-C01 Exam Prep on android
AWS DAS-C01 Exam Prep on Windows
What is SPICE?

SPICE is the Super-fast, Parallel, In-memory Calculation Engine in QuickSight. SPICE is engineered to rapidly perform advanced calculations and serve data. The storage and processing capacity available in SPICE speeds up the analytical queries that you run against your imported data. By using SPICE, you save time because you don’t need to retrieve the data every time that you change an analysis or update a visual.
When you import data into a dataset rather than using a direct SQL query, it becomes SPICE data because of how it’s stored. SPICE is the Amazon QuickSight Super-fast, Parallel, In-memory Calculation Engine. It’s engineered to rapidly perform advanced calculations and serve data. In Enterprise edition, data stored in SPICE is encrypted at rest.
When you create or edit a dataset, you choose to use either SPICE or a direct query, unless the dataset contains uploaded files. Importing (also called ingesting) your data into SPICE can save time and money:
• Your analytical queries process faster.
• You don’t need to wait for a direct query to process.
• Data stored in SPICE can be reused multiple times without incurring additional costs. If you use a data source that charges per query, you’re charged for querying the data when you first create the dataset and later when you refresh the dataset.
AWS Data Analytics Specialty Certification DAS-C01 Exam Prep on iOS
AWS DAS-C01 Exam Prep on android
AWS DAS-C01 Exam Prep on Windows
Serverless data lake reference architecture:

You can use AWS services as building blocks to build serverless data lakes and analytics pipelines. You can apply best practices on how to ingest, store, transform, and analyze structured and unstructured data at scale. Achieve the scale without needing to manage any storage or compute infrastructure. A decoupled, component-driven architecture allows you to start small and scale out slowly. You can quickly add new purpose-built components to one of six architecture layers to address new requirements and data sources.
This data lake-centric architecture can support business intelligence (BI) dashboarding, interactive SQL queries, big data processing, predictive analytics, and machine learning use cases.
• The ingestion layer includes protocols to support ingestion of structured, unstructured, or streaming data from a variety of sources.
• The storage layer provides durable, scalable, secure, and cost-effective storage of datasets across ingestion and processing.
• The landing zone stores data as ingested.
• Data engineers run initial quality checks to validate and cleanse data in the landing zone, producing the raw dataset.
• The processing layer creates curated datasets by further cleansing, normalizing, standardizing, and enriching data from the raw zone. The curated dataset is typically stored in formats that support performant and cost-effective access by the consumption layer.
• The catalog layer stores business and technical metadata about the datasets hosted in the storage layer.
• The consumption layer contains functionality for Search, Analytics, and Visualization. It integrates with the data lake storage, cataloging, and security layers. This integration supports analysis methods such as SQL, batch analytics, BI dashboards, reporting, and ML.
• The security and monitoring layer protects data within the storage layer and other resources in the data lake. This layer includes access control, encryption, network protection, usage monitoring, and auditing.
You can learn more about this reference architecture at AWS Big Data Blog: AWS serverless data analytics pipeline reference architecture: https://aws.amazon.com/blogs/big-data/aws-serverless-data-analytics-pipeline-reference-architecture/
What are Data Lakes Best Practices?

The main challenge with a data lake architecture is that raw data is stored with no oversight of the contents. To make the data usable, you must have defined mechanisms to catalog and secure the data. Without these mechanisms, data cannot be found or trusted, resulting in a “data swamp.” Meeting the needs of diverse stakeholders requires data lakes to have governance, semantic consistency, and access controls.
The Analytics Lens for the AWS Well-Architected Framework covers common analytics applications scenarios, including data lakes. It identifies key elements to help you architect your data lake according to best practices, including the following configuration notes:
• Decide on a location for data lake ingestion (that is, an S3 bucket). Select a frequency and isolation mechanism that meets your business needs.
• For Tier 2 Data, partition the data with keys that align to common query filter
. This enables pruning by common analytics tools that work on raw data files and increases performance
• Choose optimal file sizes to reduce Amazon S3 round trips during compute environment ingestion. Recommended: 512 MB – 1 GB in a columnar format (ORC/Parquet) per partition.
• Perform frequent scheduled compactions that align to the optimal file sizes noted previously. For example, compact into daily partitions if hourly files are too small.
• For data with frequent updates or deletes (that is, mutable data), either: o Temporarily store replicated data to a database like Amazon Redshift, Apache Hive, or Amazon RDS. Once the data becomes static, and then offload it to Amazon S3. Or, o Append the data to delta files per partition and compact it on a scheduled basis. You can use AWS Glue or Apache Spark on Amazon EMR for this processing.
With Tier 2 and Tier 3 Data being stored in Amazon S3, partition data using a high cardinality key. This is honored by Presto, Apache Hive, and Apache Spark and improves the query filter performance on that key
• Sort data in each partition with a secondary key that aligns to common filter queries. This allows query engines to skip files and get to requested data faster. For more information on the Analytics Lens for the AWS Well-Architected Framework, visit https://docs.aws.amazon.com/wellarchitected/latest/analytics-lens/data-lake.html
References:
For additional information on AWS data lakes and data analytics architectures, visit:
• AWS Well-Architected: Learn, measure, and build using architectural best practices: https://aws.amazon.com/architecture/well-architected
• AWS Lake Formation: Build a secure data lake in days: https://aws.amazon.com/lake-formation
• Getting Started with Amazon S3: https://aws.amazon.com/s3/getting-started
• Security in AWS Lake Formation: https://docs.aws.amazon.com/lake-formation/latest/dg/security.html
AWS Lake Formation: How It Works: https://docs.aws.amazon.com/lake-formation/latest/dg/how-it-works.html
• AWS Lake Formation Dashboard: https://us-west-2.console.aws.amazon.com/lakeformation
• Data Lake Storage on AWS: https://aws.amazon.com/products/storage/data-lake-storage/
• Building Big Data Storage Solutions (Data Lakes) for Maximum Flexibility: https://docs.aws.amazon.com/whitepapers/latest/building-data-lakes/building-data-lake-aws.html
• Data Ingestion Methods: https://docs.aws.amazon.com/whitepapers/latest/building-data-lakes/data-ingestion-methods.html
What are the corresponding Azure and Google Cloud services for each of the AWS services?
AI Dashboard is available on the Web, Apple, Google, and Microsoft, PRO version
What are the corresponding Azure and Google Cloud services for each of the AWS services?
What are unique distinctions and similarities between AWS, Azure and Google Cloud services? For each AWS service, what is the equivalent Azure and Google Cloud service? For each Azure service, what is the corresponding Google Service? AWS Services vs Azure vs Google Services? Side by side comparison between AWS, Google Cloud and Azure Service?
For a better experience, use the mobile app here.

1
Category: Marketplace
Easy-to-deploy and automatically configured third-party applications, including single virtual machine or multiple virtual machine solutions.
References:
[AWS]:AWS Marketplace
[Azure]:Azure Marketplace
[Google]:Google Cloud Marketplace
Tags: #AWSMarketplace, #AzureMarketPlace, #GoogleMarketplace
Differences: They are both digital catalog with thousands of software listings from independent software vendors that make it easy to find, test, buy, and deploy software that runs on their respective cloud platform.
Get 20% off Google Google Workspace (Google Meet) Standard Plan with the following codes: 96DRHDRA9J7GTN6
Get 20% off Google Workspace (Google Meet) Business Plan (AMERICAS): M9HNXHX3WC9H7YE (Email us for more codes)
Active Anti-Aging Eye Gel, Reduces Dark Circles, Puffy Eyes, Crow's Feet and Fine Lines & Wrinkles, Packed with Hyaluronic Acid & Age Defying Botanicals
2
Category: AI and machine learning
A cloud service to train, deploy, automate, and manage machine learning models.
References:
[AWS]:AWS SageMaker(build, train and deploy machine learning models), AWS DeepComposer (ML enabled musical keyboard), Amazon Fraud Detector (Detect more online fraud faster), Amazon CodeGuru (Automate code reviews and identify expensive lines of code), Contact Lens for Amazon Connect (Contact center analytics powered by ML), Amazon Kendra (Reinvent enterprise search with ML), Amazon Augmented AI (Easily implement human review of ML predictions), Amazon SageMaker Studio (The first visual IDE for machine learning), Amazon SageMaker Notebooks (Quickly start and share ML notebooks), Amazon SageMaker Experiments (Organize, track, and evaluate ML experiments), Amazon SageMaker Debugger (Analyze and debug ML models in real time), Amazon SageMaker Autopilot (Automatically create high quality ML models), Amazon SageMaker Model Monitor (Continuously monitor ML models)
[Azure]:Azure Machine Learning
[Google]:Google Cloud TensorFlow
Tags: #AI, #CloudAI, #SageMaker, #AzureMachineLearning, #TensorFlow
Differences: According to the StackShare community, Azure Machine Learning has a broader approval, being mentioned in 12 company stacks & 8 developers stacks; compared to Amazon Machine Learning, which is listed in 8 company stacks and 9 developer stacks.
3
Category: AI and machine learning
Build and connect intelligent bots that interact with your users using text/SMS, Skype, Teams, Slack, Office 365 mail, Twitter, and other popular services.
References:
[AWS]:Alexa Skills Kit (enables a developer to build skills, also called conversational applications, on the Amazon Alexa artificial intelligence assistant.)
[Azure]:Microsoft Bot Framework (building enterprise-grade conversational AI experiences.)
[Google]:Google Assistant Actions ( developer platform that lets you create software to extend the functionality of the Google Assistant, Google’s virtual personal assistant,)
Tags: #AlexaSkillsKit, #MicrosoftBotFramework, #GoogleAssistant
Differences: One major advantage Google gets over Alexa is that Google Assistant is available to almost all Android devices.
4
Category: AI and machine learning
Description:API capable of converting speech to text, understanding intent, and converting text back to speech for natural responsiveness.
References:
[AWS]:Amazon Lex (building conversational interfaces into any application using voice and text.)
[Azure]:Azure Speech Services(unification of speech-to-text, text-to-speech, and speech translation into a single Azure subscription)
[Google]:Google APi.ai, AI Hub (Hosted repo of plug-and-play AI component), AI building blocks(for developers to add sight, language, conversation, and structured data to their applications.), AI Platform(code-based data science development environment, lets ML developers and data scientists quickly take projects from ideation to deployment.), DialogFlow (Google-owned developer of human–computer interaction technologies based on natural language conversations. ), TensorFlow(Open Source Machine Learning platform)
Tags: #AmazonLex, #CogintiveServices, #AzureSpeech, #Api.ai, #DialogFlow, #Tensorflow
Differences: api.ai provides us with such a platform which is easy to learn and comprehensive to develop conversation actions. It is a good example of the simplistic approach to solving complex man to machine communication problem using natural language processing in proximity to machine learning. Api.ai supports context based conversations now, which reduces the overhead of handling user context in session parameters. On the other hand in Lex this has to be handled in session. Also, api.ai can be used for both voice and text based conversations (assistant actions can be easily created using api.ai).
5
Category: AI and machine learning
Description:Computer Vision: Extract information from images to categorize and process visual data.
References:
[AWS]:Amazon Rekognition (based on the same proven, highly scalable, deep learning technology developed by Amazon’s computer vision scientists to analyze billions of images and videos daily. It requires no machine learning expertise to use.)
[Azure]:Cognitive Services(bring AI within reach of every developer—without requiring machine-learning expertise.)
[Google]:Google Vision (offers powerful pre-trained machine learning models through REST and RPC APIs.)
Tags: AmazonRekognition, #GoogleVision, #AzureSpeech
Differences: For now, only Google Cloud Vision supports batch processing. Videos are not natively supported by Google Cloud Vision or Amazon Rekognition. The Object Detection functionality of Google Cloud Vision and Amazon Rekognition is almost identical, both syntactically and semantically.
Differences:
Google Cloud Vision and Amazon Rekognition offer a broad spectrum of solutions, some of which are comparable in terms of functional details, quality, performance, and costs.
6
Category: Big data and analytics: Data warehouse
Description:Cloud-based Enterprise Data Warehouse (EDW) that uses Massively Parallel Processing (MPP) to quickly run complex queries across petabytes of data.
References:
[AWS]:AWS Redshift (scalable data warehouse that makes it simple and cost-effective to analyze all your data across your data warehouse and data lake.), Amazon Redshift Data Lake Export (Save query results in an open format),Amazon Redshift Federated Query(Run queries n line transactional data), Amazon Redshift RA3(Optimize costs with up to 3x better performance), AQUA: AQUA: Advanced Query Accelerator for Amazon Redshift (Power analytics with a new hardware-accelerated cache), UltraWarm for Amazon Elasticsearch Service(Store logs at ~1/10th the cost of existing storage tiers )
[Azure]:Azure Synapse formerly SQL Data Warehouse (limitless analytics service that brings together enterprise data warehousing and Big Data analytics.)
[Google]:BigQuery (RESTful web service that enables interactive analysis of massive datasets working in conjunction with Google Storage. )
Tags:#AWSRedshift, #GoogleBigQuery, #AzureSynapseAnalytics
Differences: Loading data, Managing resources (and hence pricing), Ecosystem. Ecosystem is where Redshift is clearly ahead of BigQuery. While BigQuery is an affordable, performant alternative to Redshift, they are considered to be more up and coming
7
Category: Big data and analytics: Data warehouse
Description: Apache Spark-based analytics platform. Managed Hadoop service. Data orchestration, ETL, Analytics and visualization
References:
[AWS]:EMR, Data Pipeline, Kinesis Stream, Kinesis Firehose, Glue, QuickSight, Athena, CloudSearch
[Azure]:Azure Databricks, Data Catalog Cortana Intelligence, HDInsight, Power BI, Azure Datafactory, Azure Search, Azure Data Lake Anlytics, Stream Analytics, Azure Machine Learning
[Google]:Cloud DataProc, Machine Learning, Cloud Datalab
Tags:#EMR, #DataPipeline, #Kinesis, #Cortana, AzureDatafactory, #AzureDataAnlytics, #CloudDataProc, #MachineLearning, #CloudDatalab
Differences: All three providers offer similar building blocks; data processing, data orchestration, streaming analytics, machine learning and visualisations. AWS certainly has all the bases covered with a solid set of products that will meet most needs. Azure offers a comprehensive and impressive suite of managed analytical products. They support open source big data solutions alongside new serverless analytical products such as Data Lake. Google provide their own twist to cloud analytics with their range of services. With Dataproc and Dataflow, Google have a strong core to their proposition. Tensorflow has been getting a lot of attention recently and there will be many who will be keen to see Machine Learning come out of preview.
8
Category: Virtual servers
Description:Virtual servers allow users to deploy, manage, and maintain OS and server software. Instance types provide combinations of CPU/RAM. Users pay for what they use with the flexibility to change sizes.
Batch: Run large-scale parallel and high-performance computing applications efficiently in the cloud.
References:
[AWS]:Elastic Compute Cloud (EC2), Amazon Bracket(Explore and experiment with quantum computing), Amazon Ec2 M6g Instances (Achieve up to 40% better price performance), Amazon Ec2 Inf1 instancs (Deliver cost-effective ML inference), AWS Graviton2 Processors (Optimize price performance for cloud workloads), AWS Batch, AWS AutoScaling, VMware Cloud on AWS, AWS Local Zones (Run low latency applications at the edge), AWS Wavelength (Deliver ultra-low latency applications for 5G devices), AWS Nitro Enclaves (Further protect highly sensitive data), AWS Outposts (Run AWS infrastructure and services on-premises)
[Azure]:Azure Virtual Machines, Azure Batch, Virtual Machine Scale Sets, Azure VMware by CloudSimple
[Google]:Compute Engine, Preemptible Virtual Machines, Managed instance groups (MIGs), Google Cloud VMware Solution by CloudSimple
Tags: #AWSEC2, #AWSBatch, #AWSAutoscaling, #AzureVirtualMachine, #AzureBatch, #VirtualMachineScaleSets, #AzureVMWare, #ComputeEngine, #MIGS, #VMWare
Differences: There is very little to choose between the 3 providers when it comes to virtual servers. Amazon has some impressive high end kit, on the face of it this sound like it would make AWS a clear winner. However, if your only option is to choose the biggest box available you will need to make sure you have very deep pockets, and perhaps your money may be better spent re-architecting your apps for horizontal scale.Azure’s remains very strong in the PaaS space and now has a IaaS that can genuinely compete with AWS
Google offers a simple and very capable set of services that are easy to understand. However, with availability in only 5 regions it does not have the coverage of the other players.
9
Category: Containers and container orchestrators
Description: A container is a standard unit of software that packages up code and all its dependencies so the application runs quickly and reliably from one computing environment to another.
Container orchestration is all about managing the lifecycles of containers, especially in large, dynamic environments.
References:
[AWS]:EC2 Container Service (ECS), Fargate(Run containers without anaging servers or clusters), EC2 Container Registry(managed AWS Docker registry service that is secure, scalable, and reliable.), Elastic Container Service for Kubernetes (EKS: runs the Kubernetes management infrastructure across multiple AWS Availability Zones), App Mesh( application-level networking to make it easy for your services to communicate with each other across multiple types of compute infrastructure)
[Azure]:Azure Container Instances, Azure Container Registry, Azure Kubernetes Service (AKS), Service Fabric Mesh
[Google]:Google Container Engine, Container Registry, Kubernetes Engine
Tags:#ECS, #Fargate, #EKS, #AppMesh, #ContainerEngine, #ContainerRegistry, #AKS
Differences: Google Container Engine, AWS Container Services, and Azure Container Instances can be used to run docker containers. Google offers a simple and very capable set of services that are easy to understand. However, with availability in only 5 regions it does not have the coverage of the other players.
10
Category: Serverless
Description: Integrate systems and run backend processes in response to events or schedules without provisioning or managing servers.
References:
[AWS]:AWS Lambda
[Azure]:Azure Functions
[Google]:Google Cloud Functions
Tags:#AWSLAmbda, #AzureFunctions, #GoogleCloudFunctions
Differences: Both AWS Lambda and Microsoft Azure Functions and Google Cloud Functions offer dynamic, configurable triggers that you can use to invoke your functions on their platforms. AWS Lambda, Azure and Google Cloud Functions support Node.js, Python, and C#. The beauty of serverless development is that, with minor changes, the code you write for one service should be portable to another with little effort – simply modify some interfaces, handle any input/output transforms, and an AWS Lambda Node.JS function is indistinguishable from a Microsoft Azure Node.js Function. AWS Lambda provides further support for Python and Java, while Azure Functions provides support for F# and PHP. AWS Lambda is built from the AMI, which runs on Linux, while Microsoft Azure Functions run in a Windows environment. AWS Lambda uses the AWS Machine architecture to reduce the scope of containerization, letting you spin up and tear down individual pieces of functionality in your application at will.
11
Category: Relational databases
Description: Managed relational database service where resiliency, scale, and maintenance are primarily handled by the platform.
References:
[AWS]:AWS RDS(MySQL and PostgreSQL-compatible relational database built for the cloud,), Aurora(MySQL and PostgreSQL-compatible relational database built for the cloud)
[Azure]:SQL Database, Azure Database for MySQL, Azure Database for PostgreSQL
[Google]:Cloud SQL
Tags: #AWSRDS, #AWSAUrora, #AzureSQlDatabase, #AzureDatabaseforMySQL, #GoogleCloudSQL
Differences: All three providers boast impressive relational database offering. RDS supports an impressive range of managed relational stores while Azure SQL Database is probably the most advanced managed relational database available today. Azure also has the best out-of-the-box support for cross-region geo-replication across its database offerings.
12
Category: NoSQL, Document Databases
Description:A globally distributed, multi-model database that natively supports multiple data models: key-value, documents, graphs, and columnar.
References:
[AWS]:DynamoDB (key-value and document database that delivers single-digit millisecond performance at any scale.), SimpleDB ( a simple web services interface to create and store multiple data sets, query your data easily, and return the results.), Managed Cassandra Services(MCS)
[Azure]:Table Storage, DocumentDB, Azure Cosmos DB
[Google]:Cloud Datastore (handles sharding and replication in order to provide you with a highly available and consistent database. )
Tags:#AWSDynamoDB, #SimpleDB, #TableSTorage, #DocumentDB, AzureCosmosDB, #GoogleCloudDataStore
Differences:DynamoDB and Cloud Datastore are based on the document store database model and are therefore similar in nature to open-source solutions MongoDB and CouchDB. In other words, each database is fundamentally a key-value store. With more workloads moving to the cloud the need for NoSQL databases will become ever more important, and again all providers have a good range of options to satisfy most performance/cost requirements. Of all the NoSQL products on offer it’s hard not to be impressed by DocumentDB; Azure also has the best out-of-the-box support for cross-region geo-replication across its database offerings.
13
Category:Caching
Description:An in-memory–based, distributed caching service that provides a high-performance store typically used to offload non transactional work from a database.
References:
[AWS]:AWS ElastiCache (works as an in-memory data store and cache to support the most demanding applications requiring sub-millisecond response times.)
[Azure]:Azure Cache for Redis (based on the popular software Redis. It is typically used as a cache to improve the performance and scalability of systems that rely heavily on backend data-stores.)
[Google]:Memcache (In-memory key-value store, originally intended for caching)
Tags:#Redis, #Memcached
<Differences: They all support horizontal scaling via sharding.They all improve the performance of web applications by allowing you to retrive information from fast, in-memory caches, instead of relying on slower disk-based databases.”, “Differences”: “ElastiCache supports Memcached and Redis. Memcached Cloud provides various data persistence options as well as remote backups for disaster recovery purposes. Redis offers persistence to disk, Memcache does not. This can be very helpful if you cache lots of data, since you remove the slowness around having a fully cold cache. Redis also offers several extra data structures that Memcache doesn’t— Lists, Sets, Sorted Sets, etc. Memcache only has Key/Value pairs. Memcache is multi-threaded. Redis is single-threaded and event driven. Redis is very fast, but it’ll never be multi-threaded. At hight scale, you can squeeze more connections and transactions out of Memcache. Memcache tends to be more memory efficient. This can make a big difference around the magnitude of 10s of millions or 100s of millions of keys. ElastiCache supports Memcached and Redis. Memcached Cloud provides various data persistence options as well as remote backups for disaster recovery purposes. Redis offers persistence to disk, Memcache does not. This can be very helpful if you cache lots of data, since you remove the slowness around having a fully cold cache. Redis also offers several extra data structures that Memcache doesn’t— Lists, Sets, Sorted Sets, etc. Memcache only has Key/Value pairs. Memcache is multi-threaded. Redis is single-threaded and event driven. Redis is very fast, but it’ll never be multi-threaded. At hight scale, you can squeeze more connections and transactions out of Memcache. Memcache tends to be more memory efficient. This can make a big difference around the magnitude of 10s of millions or 100s of millions of keys.
14
Category: Security, identity, and access
Description:Authentication and authorization: Allows users to securely control access to services and resources while offering data security and protection. Create and manage users and groups, and use permissions to allow and deny access to resources.
References:
[AWS]:Identity and Access Management (IAM), AWS Organizations, Multi-Factor Authentication, AWS Directory Service, Cognito(provides solutions to control access to backend resources from your app), Amazon Detective (Investigate potential security issues), AWS IAM Access Analyzer(Easily analyze resource accessibility)
[Azure]:Azure Active Directory, Azure Subscription Management + Azure RBAC, Multi-Factor Authentication, Azure Active Directory Domain Services, Azure Active Directory B2C, Azure Policy, Management Groups
[Google]:Cloud Identity, Identity Platform, Cloud IAM, Policy Intelligence, Cloud Resource Manager, Cloud Identity-Aware Proxy, Context-aware accessManaged Service for Microsoft Active Directory, Security key enforcement, Titan Security Key
Tags: #IAM, #AWSIAM, #AzureIAM, #GoogleIAM, #Multi-factorAuthentication
Differences: One unique thing about AWS IAM is that accounts created in the organization (not through federation) can only be used within that organization. This contrasts with Google and Microsoft. On the good side, every organization is self-contained. On the bad side, users can end up with multiple sets of credentials they need to manage to access different organizations. The second unique element is that every user can have a non-interactive account by creating and using access keys, an interactive account by enabling console access, or both. (Side note: To use the CLI, you need to have access keys generated.)
15
Category: Object Storage and Content delivery
Description:Object storage service, for use cases including cloud applications, content distribution, backup, archiving, disaster recovery, and big data analytics.
References:
[AWS]:Simple Storage Services (S3), Import/Export(used to move large amounts of data into and out of the Amazon Web Services public cloud using portable storage devices for transport.), Snowball( petabyte-scale data transport solution that uses devices designed to be secure to transfer large amounts of data into and out of the AWS Cloud), CloudFront( content delivery network (CDN) is massively scaled and globally distributed), Elastic Block Store (EBS: high performance block storage service), Elastic File System(shared, elastic file storage system that grows and shrinks as you add and remove files.), S3 Infrequent Access (IA: is for data that is accessed less frequently, but requires rapid access when needed. ), S3 Glacier( long-term storage of data that is infrequently accessed and for which retrieval latency times of 3 to 5 hours are acceptable.), AWS Backup( makes it easy to centralize and automate the back up of data across AWS services in the cloud as well as on-premises using the AWS Storage Gateway.), Storage Gateway(hybrid cloud storage service that gives you on-premises access to virtually unlimited cloud storage), AWS Import/Export Disk(accelerates moving large amounts of data into and out of AWS using portable storage devices for transport)
[Azure]:Azure Blob storage, File Storage, Data Lake Store, Azure Backup, Azure managed disks, Azure Files, Azure Storage cool tier, Azure Storage archive access tier, Azure Backup, StorSimple, Import/Export
[Google]:Cloud Storage, GlusterFS, CloudCDN
Tags:#S3, #AzureBlobStorage, #CloudStorage
Differences:Source: All providers have good object storage options and so storage alone is unlikely to be a deciding factor when choosing a cloud provider. The exception perhaps is for hybrid scenarios, in this case Azure and AWS clearly win. AWS and Google’s support for automatic versioning is a great feature that is currently missing from Azure; however Microsoft’s fully managed Data Lake Store offers an additional option that will appeal to organisations who are looking to run large scale analytical workloads. If you are prepared to wait 4 hours for your data and you have considerable amounts of the stuff then AWS Glacier storage might be a good option. If you use the common programming patterns for atomic updates and consistency, such as etags and the if-match family of headers, then you should be aware that AWS does not support them, though Google and Azure do. Azure also supports blob leasing, which can be used to provide a distributed lock.
16
Category:Internet of things (IoT)
Description:A cloud gateway for managing bidirectional communication with billions of IoT devices, securely and at scale. Deploy cloud intelligence directly on IoT devices to run in on-premises scenarios.
References:
[AWS]:AWS IoT (Internet of Things), AWS Greengrass, Kinesis Firehose, Kinesis Streams, AWS IoT Things Graph
[Azure]:Azure IoT Hub, Azure IoT Edge, Event Hubs, Azure Digital Twins, Azure Sphere
[Google]:Google Cloud IoT Core, Firebase, Brillo, Weave, CLoud Pub/SUb, Stream Analysis, Big Query, Big Query Streaming API
Tags:#IoT, #InternetOfThings, #Firebase
Differences:AWS and Azure have a more coherent message with their products clearly integrated into their respective platforms, whereas Google Firebase feels like a distinctly separate product.
Unlock the Secrets of Africa: Master African History, Geography, Culture, People, Cuisine, Economics, Languages, Music, Wildlife, Football, Politics, Animals, Tourism, Science and Environment with the Top 1000 Africa Quiz and Trivia. Get Yours Now!
"Become a Canada Expert: Ace the Citizenship Test and Impress Everyone with Your Knowledge of Canadian History, Geography, Government, Culture, People, Languages, Travel, Wildlife, Hockey, Tourism, Sceneries, Arts, and Data Visualization. Get the Top 1000 Canada Quiz Now!"
17
Category:Web Applications
Description:Managed hosting platform providing easy to use services for deploying and scaling web applications and services. API Gateway is a a turnkey solution for publishing APIs to external and internal consumers. Cloudfront is a global content delivery network that delivers audio, video, applications, images, and other files.
References:
[AWS]:Elastic Beanstalk (for deploying and scaling web applications and services developed with Java, .NET, PHP, Node.js, Python, Ruby, Go, and Docker on familiar servers such as Apache, Nginx, Passenger, and IIS), AWS Wavelength (for delivering ultra-low latency applications for 5G), API Gateway (makes it easy for developers to create, publish, maintain, monitor, and secure APIs at any scale.), CloudFront (web service that speeds up distribution of your static and dynamic web content, such as .html, .css, .js, and image files, to your users. CloudFront delivers your content through a worldwide network of data centers called edge locations.),Global Accelerator ( improves the availability and performance of your applications with local or global users. It provides static IP addresses that act as a fixed entry point to your application endpoints in a single or multiple AWS Regions, such as your Application Load Balancers, Network Load Balancers or Amazon EC2 instances.)AWS AppSync (simplifies application development by letting you create a flexible API to securely access, manipulate, and combine data from one or more data sources: GraphQL service with real-time data synchronization and offline programming features. )
[Azure]:App Service, API Management, Azure Content Delivery Network, Azure Content Delivery Network
[Google]:App Engine, Cloud API, Cloud Enpoint, APIGee
Tags: #AWSElasticBeanstalk, #AzureAppService, #GoogleAppEngine, #CloudEnpoint, #CloudFront, #APIgee
Differences: With AWS Elastic Beanstalk, developers retain full control over the AWS resources powering their application. If developers decide they want to manage some (or all) of the elements of their infrastructure, they can do so seamlessly by using Elastic Beanstalk’s management capabilities. AWS Elastic Beanstalk integrates with more apps than Google App Engines (Datadog, Jenkins, Docker, Slack, Github, Eclipse, etc..). Google App Engine has more features than AWS Elastic BEanstalk (App Identity, Java runtime, Datastore, Blobstore, Images, Go Runtime, etc..). Developers describe Amazon API Gateway as “Create, publish, maintain, monitor, and secure APIs at any scale”. Amazon API Gateway handles all the tasks involved in accepting and processing up to hundreds of thousands of concurrent API calls, including traffic management, authorization and access control, monitoring, and API version management. On the other hand, Google Cloud Endpoints is detailed as “Develop, deploy and manage APIs on any Google Cloud backend”. An NGINX-based proxy and distributed architecture give unparalleled performance and scalability. Using an Open API Specification or one of our API frameworks, Cloud Endpoints gives you the tools you need for every phase of API development and provides insight with Google Cloud Monitoring, Cloud Trace, Google Cloud Logging and Cloud Trace.
18
Category:Encryption
Description:Helps you protect and safeguard your data and meet your organizational security and compliance commitments.
References:
[AWS]:Key Management Service AWS KMS, CloudHSM
[Azure]:Key Vault
[Google]:Encryption By Default at Rest, Cloud KMS
Tags:#AWSKMS, #Encryption, #CloudHSM, #EncryptionAtRest, #CloudKMS
Differences: AWS KMS, is an ideal solution for organizations that want to manage encryption keys in conjunction with other AWS services. In contrast to AWS CloudHSM, AWS KMS provides a complete set of tools to manage encryption keys, develop applications and integrate with other AWS services. Google and Azure offer 4096 RSA. AWS and Google offer 256 bit AES. With AWs, you can bring your own key
19
Category:Internet of things (IoT)
Description:A cloud gateway for managing bidirectional communication with billions of IoT devices, securely and at scale. Deploy cloud intelligence directly on IoT devices to run in on-premises scenarios.
References:
[AWS]:AWS IoT, AWS Greengrass, Kinesis Firehose ( captures and loads streaming data in storage and business intelligence (BI) tools to enable near real-time analytics in the AWS cloud), Kinesis Streams (for rapid and continuous data intake and aggregation.), AWS IoT Things Graph (makes it easy to visually connect different devices and web services to build IoT applications.)
[Azure]:Azure IoT Hub, Azure IoT Edge, Event Hubs, Azure Digital Twins, Azure Sphere
[Google]:Google Cloud IoT Core, Firebase, Brillo, Weave, CLoud Pub/SUb, Stream Analysis, Big Query, Big Query Streaming API
Tags:#IoT, #InternetOfThings, #Firebase
Differences:AWS and Azure have a more coherent message with their products clearly integrated into their respective platforms, whereas Google Firebase feels like a distinctly separate product.
20
Category:Object Storage and Content delivery
Description: Object storage service, for use cases including cloud applications, content distribution, backup, archiving, disaster recovery, and big data analytics.
References:
[AWS]:Simple Storage Services (S3), Import/Export Snowball, CloudFront, Elastic Block Store (EBS), Elastic File System, S3 Infrequent Access (IA), S3 Glacier, AWS Backup, Storage Gateway, AWS Import/Export Disk, Amazon S3 Access Points(Easily manage access for shared data)
[Azure]:Azure Blob storage, File Storage, Data Lake Store, Azure Backup, Azure managed disks, Azure Files, Azure Storage cool tier, Azure Storage archive access tier, Azure Backup, StorSimple, Import/Export
[Google]:Cloud Storage, GlusterFS, CloudCDN
Tags:#S3, #AzureBlobStorage, #CloudStorage
Differences:All providers have good object storage options and so storage alone is unlikely to be a deciding factor when choosing a cloud provider. The exception perhaps is for hybrid scenarios, in this case Azure and AWS clearly win. AWS and Google’s support for automatic versioning is a great feature that is currently missing from Azure; however Microsoft’s fully managed Data Lake Store offers an additional option that will appeal to organisations who are looking to run large scale analytical workloads. If you are prepared to wait 4 hours for your data and you have considerable amounts of the stuff then AWS Glacier storage might be a good option. If you use the common programming patterns for atomic updates and consistency, such as etags and the if-match family of headers, then you should be aware that AWS does not support them, though Google and Azure do. Azure also supports blob leasing, which can be used to provide a distributed lock.
21
Category: Backend process logic
Description: Cloud technology to build distributed applications using out-of-the-box connectors to reduce integration challenges. Connect apps, data and devices on-premises or in the cloud.
References:
[AWS]:AWS Step Functions ( lets you build visual workflows that enable fast translation of business requirements into technical requirements. You can build applications in a matter of minutes, and when needs change, you can swap or reorganize components without customizing any code.)
[Azure]:Logic Apps (cloud service that helps you schedule, automate, and orchestrate tasks, business processes, and workflows when you need to integrate apps, data, systems, and services across enterprises or organizations.)
[Google]:Dataflow ( fully managed service for executing Apache Beam pipelines within the Google Cloud Platform ecosystem.)
Tags:#AWSStepFunctions, #LogicApps, #Dataflow
Differences: AWS Step Functions makes it easy to coordinate the components of distributed applications and microservices using visual workflows. Building applications from individual components that each perform a discrete function lets you scale and change applications quickly. AWS Step Functions belongs to \”Cloud Task Management\” category of the tech stack, while Google Cloud Dataflow can be primarily classified under \”Real-time Data Processing\”. According to the StackShare community, Google Cloud Dataflow has a broader approval, being mentioned in 32 company stacks & 8 developers stacks; compared to AWS Step Functions, which is listed in 19 company stacks and 7 developer stacks.
22
Category: Enterprise application services
Description:Fully integrated Cloud service providing communications, email, document management in the cloud and available on a wide variety of devices.
References:
[AWS]:Amazon WorkMail, Amazon WorkDocs, Amazon Kendra (Sync and Index)
[Azure]:Office 365
[Google]:G Suite
Tags: #AmazonWorkDocs, #Office365, #GoogleGSuite
Differences: G suite document processing applications like Google Docs are far behind Office 365 popular Word and Excel software, but G Suite User interface is intuite, simple and easy to navigate. Office 365 is too clunky. Get 20% off G-Suite Business Plan with Promo Code: PCQ49CJYK7EATNC
23
Category: Networking
Description: Provides an isolated, private environment in the cloud. Users have control over their virtual networking environment, including selection of their own IP address range, creation of subnets, and configuration of route tables and network gateways.
References:
[AWS]:Virtual Private Cloud (VPC), Cloud virtual networking, Subnets, Elastic Network Interface (ENI), Route Tables, Network ACL, Secutity Groups, Internet Gateway, NAT Gateway, AWS VPN Gateway, AWS Route 53, AWS Direct Connect, AWS Network Load Balancer, VPN CloudHub, AWS Local Zones, AWS Transit Gateway network manager (Centrally manage global networks)
[Azure]:Virtual Network(provide services for building networks within Azure.),Subnets (network resources can be grouped by subnet for organisation and security.), Network Interface (Each virtual machine can be assigned one or more network interfaces (NICs)), Network Security Groups (NSG: contains a set of prioritised ACL rules that explicitly grant or deny access), Azure VPN Gateway ( allows connectivity to on-premise networks), Azure DNS, Traffic Manager (DNS based traffic routing solution.), ExpressRoute (provides connections up to 10 Gbps to Azure services over a dedicated fibre connection), Azure Load Balancer, Network Peering, Azure Stack (Azure Stack allows organisations to use Azure services running in private data centers.), Azure Load Balancer , Azure Log Analytics, Azure DNS,
[Google]:Cloud Virtual Network, Subnets, Network Interface, Protocol fowarding, Cloud VPN, Cloud DNS, Virtual Private Network, Cloud Interconnect, CDN interconnect, Cloud DNS, Stackdriver, Google Cloud Load Balancing,
Tags:#VPC, #Subnets, #ACL, #VPNGateway, #CloudVPN, #NetworkInterface, #ENI, #RouteTables, #NSG, #NetworkACL, #InternetGateway, #NatGateway, #ExpressRoute, #CloudInterConnect, #StackDriver
Differences: Subnets group related resources, however, unlike AWS and Azure, Google do not constrain the private IP address ranges of subnets to the address space of the parent network. Like Azure, Google has a built in internet gateway that can be specified from routing rules.
24
Category: Management
Description: A unified management console that simplifies building, deploying, and operating your cloud resources.
References:
[AWS]: AWS Management Console, Trusted Advisor, AWS Usage and Billing Report, AWS Application Discovery Service, Amazon EC2 Systems Manager, AWS Personal Health Dashboard, AWS Compute Optimizer (Identify optimal AWS Compute resources)
[Azure]:Azure portal, Azure Advisor, Azure Billing API, Azure Migrate, Azure Monitor, Azure Resource Health
[Google]:Google CLoud Platform, Cost Management, Security Command Center, StackDriver
Tags: #AWSConsole, #AzurePortal, #GoogleCloudConsole, #TrustedAdvisor, #AzureMonitor, #SecurityCommandCenter
Differences: AWS Console categorizes its Infrastructure as a Service offerings into Compute, Storage and Content Delivery Network (CDN), Database, and Networking to help businesses and individuals grow. Azure excels in the Hybrid Cloud space allowing companies to integrate onsite servers with cloud offerings. Google has a strong offering in containers, since Google developed the Kubernetes standard that AWS and Azure now offer. GCP specializes in high compute offerings like Big Data, analytics and machine learning. It also offers considerable scale and load balancing – Google knows data centers and fast response time.
25
Category: DevOps and application monitoring
Description: Comprehensive solution for collecting, analyzing, and acting on telemetry from your cloud and on-premises environments; Cloud services for collaborating on code development; Collection of tools for building, debugging, deploying, diagnosing, and managing multiplatform scalable apps and services; Fully managed build service that supports continuous integration and deployment.
References:
[AWS]:AWS CodePipeline(orchestrates workflow for continuous integration, continuous delivery, and continuous deployment), AWS CloudWatch (monitor your AWS resources and the applications you run on AWS in real time. ), AWS X-Ray (application performance management service that enables a developer to analyze and debug applications in aws), AWS CodeDeploy (automates code deployments to Elastic Compute Cloud (EC2) and on-premises servers. ), AWS CodeCommit ( source code storage and version-control service), AWS Developer Tools, AWS CodeBuild (continuous integration service that compiles source code, runs tests, and produces software packages that are ready to deploy. ), AWS Command Line Interface (unified tool to manage your AWS services), AWS OpsWorks (Chef-based), AWS CloudFormation ( provides a common language for you to describe and provision all the infrastructure resources in your cloud environment.), Amazon CodeGuru (for automated code reviews and application performance recommendations)
[Azure]:Azure Monitor, Azure DevOps, Azure Developer Tools, Azure CLI Azure PowerShell, Azure Automation, Azure Resource Manager , VM extensions , Azure Automation
[Google]:DevOps Solutions (Infrastructure as code, Configuration management, Secrets management, Serverless computing, Continuous delivery, Continuous integration , Stackdriver (combines metrics, logs, and metadata from all of your cloud accounts and projects into a single comprehensive view of your environment)
Tags: #CloudWatch, #StackDriver, #AzureMonitor, #AWSXray, #AWSCodeDeploy, #AzureDevOps, #GoogleDevopsSolutions
Differences: CodeCommit eliminates the need to operate your own source control system or worry about scaling its infrastructure. Azure DevOps provides unlimited private Git hosting, cloud build for continuous integration, agile planning, and release management for continuous delivery to the cloud and on-premises. Includes broad IDE support.
SageMaker | Azure Machine Learning Studio
A collaborative, drag-and-drop tool to build, test, and deploy predictive analytics solutions on your data.
Alexa Skills Kit | Microsoft Bot Framework
Build and connect intelligent bots that interact with your users using text/SMS, Skype, Teams, Slack, Office 365 mail, Twitter, and other popular services.
API capable of converting speech to text, understanding intent, and converting text back to speech for natural responsiveness.
Amazon Lex | Language Understanding (LUIS)
Allows your applications to understand user commands contextually.
Amazon Polly, Amazon Transcribe | Azure Speech Services
Enables both Speech to Text, and Text into Speech capabilities.
The Speech Services are the unification of speech-to-text, text-to-speech, and speech-translation into a single Azure subscription. It’s easy to speech enable your applications, tools, and devices with the Speech SDK, Speech Devices SDK, or REST APIs.
Amazon Polly is a Text-to-Speech (TTS) service that uses advanced deep learning technologies to synthesize speech that sounds like a human voice. With dozens of lifelike voices across a variety of languages, you can select the ideal voice and build speech-enabled applications that work in many different countries.
Amazon Transcribe is an automatic speech recognition (ASR) service that makes it easy for developers to add speech-to-text capability to their applications. Using the Amazon Transcribe API, you can analyze audio files stored in Amazon S3 and have the service return a text file of the transcribed speech.
Amazon Rekognition | Cognitive Services
Computer Vision: Extract information from images to categorize and process visual data.
Amazon Rekognition is a simple and easy to use API that can quickly analyze any image or video file stored in Amazon S3. Amazon Rekognition is always learning from new data, and we are continually adding new labels and facial recognition features to the service.
Face: Detect, identy, and analyze faces in photos.
Emotions: Recognize emotions in images.
Alexa Skill Set | Azure Virtual Assistant
The Virtual Assistant Template brings together a number of best practices we’ve identified through the building of conversational experiences and automates integration of components that we’ve found to be highly beneficial to Bot Framework developers.
Big data and analytics
Data warehouse
AWS Redshift | SQL Data Warehouse
Cloud-based Enterprise Data Warehouse (EDW) that uses Massively Parallel Processing (MPP) to quickly run complex queries across petabytes of data.
Big data processing EMR | Azure Databricks
Apache Spark-based analytics platform.
Managed Hadoop service. Deploy and manage Hadoop clusters in Azure.
Data orchestration / ETL
AWS Data Pipeline, AWS Glue | Data Factory
Processes and moves data between different compute and storage services, as well as on-premises data sources at specified intervals. Create, schedule, orchestrate, and manage data pipelines.
A fully managed service that serves as a system of registration and system of discovery for enterprise data sources
Analytics and visualization
AWS Kinesis Analytics | Stream Analytics
Data Lake Analytics | Data Lake Store
Storage and analysis platforms that create insights from large quantities of data, or data that originates from many sources.
Business intelligence tools that build visualizations, perform ad hoc analysis, and develop business insights from data.
Delivers full-text search and related search analytics and capabilities.
Amazon Athena | Azure Data Lake Analytics
Provides a serverless interactive query service that uses standard SQL for analyzing databases.
Compute
Virtual servers
Elastic Compute Cloud (EC2) | Azure Virtual Machines
Virtual servers allow users to deploy, manage, and maintain OS and server software. Instance types provide combinations of CPU/RAM. Users pay for what they use with the flexibility to change sizes.
Run large-scale parallel and high-performance computing applications efficiently in the cloud.
AWS Auto Scaling | Virtual Machine Scale Sets
Allows you to automatically change the number of VM instances. You set defined metric and thresholds that determine if the platform adds or removes instances.
VMware Cloud on AWS | Azure VMware by CloudSimple
Redeploy and extend your VMware-based enterprise workloads to Azure with Azure VMware Solution by CloudSimple. Keep using the VMware tools you already know to manage workloads on Azure without disrupting network, security, or data protection policies.
Containers and container orchestrators
EC2 Container Service (ECS), Fargate | Azure Container Instances
Azure Container Instances is the fastest and simplest way to run a container in Azure, without having to provision any virtual machines or adopt a higher-level orchestration service.
EC2 Container Registry | Azure Container Registry
Allows customers to store Docker formatted images. Used to create all types of container deployments on Azure.
Elastic Container Service for Kubernetes (EKS) | Azure Kubernetes Service (AKS)
Deploy orchestrated containerized applications with Kubernetes. Simplify monitoring and cluster management through auto upgrades and a built-in operations console.
App Mesh | Service Fabric Mesh
Fully managed service that enables developers to deploy microservices applications without managing virtual machines, storage, or networking.
AWS App Mesh is a service mesh that provides application-level networking to make it easy for your services to communicate with each other across multiple types of compute infrastructure. App Mesh standardizes how your services communicate, giving you end-to-end visibility and ensuring high-availability for your applications.
Serverless
Integrate systems and run backend processes in response to events or schedules without provisioning or managing servers.
AWS Lambda is an event-driven, serverless computing platform provided by Amazon as a part of the Amazon Web Services. It is a computing service that runs code in response to events and automatically manages the computing resources required by that code
Database
Relational database
AWS RDS | SQL Database Azure Database for MySQL Azure Database for PostgreSQL
Managed relational database service where resiliency, scale, and maintenance are primarily handled by the platform.
Amazon Relational Database Service is a distributed relational database service by Amazon Web Services. It is a web service running “in the cloud” designed to simplify the setup, operation, and scaling of a relational database for use in applications. Administration processes like patching the database software, backing up databases and enabling point-in-time recovery are managed automatically. Scaling storage and compute resources can be performed by a single API call as AWS does not offer an ssh connection to RDS instances.
NoSQL / Document
DynamoDB and SimpleDB | Azure Cosmos DB
A globally distributed, multi-model database that natively supports multiple data models: key-value, documents, graphs, and columnar.
Caching
AWS ElastiCache | Azure Cache for Redis
An in-memory–based, distributed caching service that provides a high-performance store typically used to offload non transactional work from a database.
Amazon ElastiCache is a fully managed in-memory data store and cache service by Amazon Web Services. The service improves the performance of web applications by retrieving information from managed in-memory caches, instead of relying entirely on slower disk-based databases. ElastiCache supports two open-source in-memory caching engines: Memcached and Redis.
Database migration
AWS Database Migration Service | Azure Database Migration Service
Migration of database schema and data from one database format to a specific database technology in the cloud.
AWS Database Migration Service helps you migrate databases to AWS quickly and securely. The source database remains fully operational during the migration, minimizing downtime to applications that rely on the database. The AWS Database Migration Service can migrate your data to and from most widely used commercial and open-source databases.
DevOps and application monitoring
AWS CloudWatch, AWS X-Ray | Azure Monitor
Comprehensive solution for collecting, analyzing, and acting on telemetry from your cloud and on-premises environments.
Amazon CloudWatch is a monitoring and observability service built for DevOps engineers, developers, site reliability engineers (SREs), and IT managers. CloudWatch provides you with data and actionable insights to monitor your applications, respond to system-wide performance changes, optimize resource utilization, and get a unified view of operational health. CloudWatch collects monitoring and operational data in the form of logs, metrics, and events, providing you with a unified view of AWS resources, applications, and services that run on AWS and on-premises servers.
AWS X-Ray is an application performance management service that enables a developer to analyze and debug applications in the Amazon Web Services (AWS) public cloud. A developer can use AWS X-Ray to visualize how a distributed application is performing during development or production, and across multiple AWS regions and accounts.
AWS CodeDeploy, AWS CodeCommit, AWS CodePipeline | Azure DevOps
A cloud service for collaborating on code development.
AWS CodeDeploy is a fully managed deployment service that automates software deployments to a variety of compute services such as Amazon EC2, AWS Fargate, AWS Lambda, and your on-premises servers. AWS CodeDeploy makes it easier for you to rapidly release new features, helps you avoid downtime during application deployment, and handles the complexity of updating your applications.
AWS CodePipeline is a fully managed continuous delivery service that helps you automate your release pipelines for fast and reliable application and infrastructure updates. CodePipeline automates the build, test, and deploy phases of your release process every time there is a code change, based on the release model you define.
AWS CodeCommit is a source code storage and version-control service for Amazon Web Services’ public cloud customers. CodeCommit was designed to help IT teams collaborate on software development, including continuous integration and application delivery.
AWS Developer Tools | Azure Developer Tools
Collection of tools for building, debugging, deploying, diagnosing, and managing multiplatform scalable apps and services.
The AWS Developer Tools are designed to help you build software like Amazon. They facilitate practices such as continuous delivery and infrastructure as code for serverless, containers, and Amazon EC2.
AWS CodeBuild | Azure DevOps
Fully managed build service that supports continuous integration and deployment.
AWS Command Line Interface | Azure CLI Azure PowerShell
Built on top of the native REST API across all cloud services, various programming language-specific wrappers provide easier ways to create solutions.
The AWS Command Line Interface (CLI) is a unified tool to manage your AWS services. With just one tool to download and configure, you can control multiple AWS services from the command line and automate them through scripts.
AWS OpsWorks (Chef-based) | Azure Automation
Configures and operates applications of all shapes and sizes, and provides templates to create and manage a collection of resources.
AWS OpsWorks is a configuration management service that provides managed instances of Chef and Puppet. Chef and Puppet are automation platforms that allow you to use code to automate the configurations of your servers.
AWS CloudFormation | Azure Resource Manager , VM extensions , Azure Automation
Provides a way for users to automate the manual, long-running, error-prone, and frequently repeated IT tasks.
AWS CloudFormation provides a common language for you to describe and provision all the infrastructure resources in your cloud environment. CloudFormation allows you to use a simple text file to model and provision, in an automated and secure manner, all the resources needed for your applications across all regions and accounts.
Networking
Area
Cloud virtual networking, Virtual Private Cloud (VPC) | Virtual Network
Provides an isolated, private environment in the cloud. Users have control over their virtual networking environment, including selection of their own IP address range, creation of subnets, and configuration of route tables and network gateways.
Cross-premises connectivity
AWS VPN Gateway | Azure VPN Gateway
Connects Azure virtual networks to other Azure virtual networks, or customer on-premises networks (Site To Site). Allows end users to connect to Azure services through VPN tunneling (Point To Site).
DNS management
AWS Route 53 | Azure DNS
Manage your DNS records using the same credentials and billing and support contract as your other Azure services
Route 53 | Traffic Manager
A service that hosts domain names, plus routes users to Internet applications, connects user requests to datacenters, manages traffic to apps, and improves app availability with automatic failover.
Dedicated network
AWS Direct Connect | ExpressRoute
Establishes a dedicated, private network connection from a location to the cloud provider (not over the Internet).
Load balancing
AWS Network Load Balancer | Azure Load Balancer
Azure Load Balancer load-balances traffic at layer 4 (TCP or UDP).
Application Load Balancer | Application Gateway
Application Gateway is a layer 7 load balancer. It supports SSL termination, cookie-based session affinity, and round robin for load-balancing traffic.
Internet of things (IoT)
AWS IoT | Azure IoT Hub
A cloud gateway for managing bidirectional communication with billions of IoT devices, securely and at scale.
AWS Greengrass | Azure IoT Edge
Deploy cloud intelligence directly on IoT devices to run in on-premises scenarios.
Kinesis Firehose, Kinesis Streams | Event Hubs
Services that allow the mass ingestion of small data inputs, typically from devices and sensors, to process and route the data.
AWS IoT Things Graph | Azure Digital Twins
Azure Digital Twins is an IoT service that helps you create comprehensive models of physical environments. Create spatial intelligence graphs to model the relationships and interactions between people, places, and devices. Query data from a physical space rather than disparate sensors.
Management
Trusted Advisor | Azure Advisor
Provides analysis of cloud resource configuration and security so subscribers can ensure they’re making use of best practices and optimum configurations.
AWS Usage and Billing Report | Azure Billing API
Services to help generate, monitor, forecast, and share billing data for resource usage by time, organization, or product resources.
AWS Management Console | Azure portal
A unified management console that simplifies building, deploying, and operating your cloud resources.
AWS Application Discovery Service | Azure Migrate
Assesses on-premises workloads for migration to Azure, performs performance-based sizing, and provides cost estimations.
Amazon EC2 Systems Manager | Azure Monitor
Comprehensive solution for collecting, analyzing, and acting on telemetry from your cloud and on-premises environments.
AWS Personal Health Dashboard | Azure Resource Health
Provides detailed information about the health of resources as well as recommended actions for maintaining resource health.
Security, identity, and access
Authentication and authorization
Identity and Access Management (IAM) | Azure Active Directory
Allows users to securely control access to services and resources while offering data security and protection. Create and manage users and groups, and use permissions to allow and deny access to resources.
Identity and Access Management (IAM) | Azure Role Based Access Control
Role-based access control (RBAC) helps you manage who has access to Azure resources, what they can do with those resources, and what areas they have access to.
AWS Organizations | Azure Subscription Management + Azure RBAC
Security policy and role management for working with multiple accounts.
Multi-Factor Authentication | Multi-Factor Authentication
Safeguard access to data and applications while meeting user demand for a simple sign-in process.
AWS Directory Service | Azure Active Directory Domain Services
Provides managed domain services such as domain join, group policy, LDAP, and Kerberos/NTLM authentication that are fully compatible with Windows Server Active Directory.
Cognito | Azure Active Directory B2C
A highly available, global, identity management service for consumer-facing applications that scales to hundreds of millions of identities.
AWS Organizations | Azure Policy
Azure Policy is a service in Azure that you use to create, assign, and manage policies. These policies enforce different rules and effects over your resources, so those resources stay compliant with your corporate standards and service level agreements.
AWS Organizations | Management Groups
Azure management groups provide a level of scope above subscriptions. You organize subscriptions into containers called “management groups” and apply your governance conditions to the management groups. All subscriptions within a management group automatically inherit the conditions applied to the management group. Management groups give you enterprise-grade management at a large scale, no matter what type of subscriptions you have.
Encryption
Server-side encryption with Amazon S3 Key Management Service | Azure Storage Service Encryption
Helps you protect and safeguard your data and meet your organizational security and compliance commitments.
Key Management Service AWS KMS, CloudHSM | Key Vault
Provides security solution and works with other services by providing a way to manage, create, and control encryption keys stored in hardware security modules (HSM).
Firewall
Web Application Firewall | Application Gateway – Web Application Firewall
A firewall that protects web applications from common web exploits.
Web Application Firewall | Azure Firewall
Provides inbound protection for non-HTTP/S protocols, outbound network-level protection for all ports and protocols, and application-level protection for outbound HTTP/S.
Security
Inspector | Security Center
An automated security assessment service that improves the security and compliance of applications. Automatically assess applications for vulnerabilities or deviations from best practices.
Certificate Manager | App Service Certificates available on the Portal
Service that allows customers to create, manage, and consume certificates seamlessly in the cloud.
GuardDuty | Azure Advanced Threat Protection
Detect and investigate advanced attacks on-premises and in the cloud.
AWS Artifact | Service Trust Portal
Provides access to audit reports, compliance guides, and trust documents from across cloud services.
AWS Shield | Azure DDos Protection Service
Provides cloud services with protection from distributed denial of services (DDoS) attacks.
Storage
Object storage
Simple Storage Services (S3) | Azure Blob storage
Object storage service, for use cases including cloud applications, content distribution, backup, archiving, disaster recovery, and big data analytics.
Virtual server disks
Elastic Block Store (EBS) | Azure managed disks
SSD storage optimized for I/O intensive read/write operations. For use as high-performance Azure virtual machine storage.
Shared files
Elastic File System | Azure Files
Provides a simple interface to create and configure file systems quickly, and share common files. Can be used with traditional protocols that access files over a network.
Archiving and backup
S3 Infrequent Access (IA) | Azure Storage cool tier
Cool storage is a lower-cost tier for storing data that is infrequently accessed and long-lived.
S3 Glacier | Azure Storage archive access tier
Archive storage has the lowest storage cost and higher data retrieval costs compared to hot and cool storage.
AWS Backup | Azure Backup
Back up and recover files and folders from the cloud, and provide offsite protection against data loss.
Hybrid storage
Storage Gateway | StorSimple
Integrates on-premises IT environments with cloud storage. Automates data management and storage, plus supports disaster recovery.
Bulk data transfer
AWS Import/Export Disk | Import/Export
A data transport solution that uses secure disks and appliances to transfer large amounts of data. Also offers data protection during transit.
AWS Import/Export Snowball, Snowball Edge, Snowmobile | Azure Data Box
Petabyte- to exabyte-scale data transport solution that uses secure data storage devices to transfer large amounts of data to and from Azure.
Web applications
Elastic Beanstalk | App Service
Managed hosting platform providing easy to use services for deploying and scaling web applications and services.
API Gateway | API Management
A turnkey solution for publishing APIs to external and internal consumers.
CloudFront | Azure Content Delivery Network
A global content delivery network that delivers audio, video, applications, images, and other files.
Global Accelerator | Azure Front Door
Easily join your distributed microservice architectures into a single global application using HTTP load balancing and path-based routing rules. Automate turning up new regions and scale-out with API-driven global actions, and independent fault-tolerance to your back end microservices in Azure—or anywhere.
Miscellaneous
Backend process logic
AWS Step Functions | Logic Apps
Cloud technology to build distributed applications using out-of-the-box connectors to reduce integration challenges. Connect apps, data and devices on-premises or in the cloud.
Enterprise application services
Amazon WorkMail, Amazon WorkDocs | Office 365
Fully integrated Cloud service providing communications, email, document management in the cloud and available on a wide variety of devices.
Gaming
GameLift, GameSparks | PlayFab
Managed services for hosting dedicated game servers.
Media transcoding
Elastic Transcoder | Media Services
Services that offer broadcast-quality video streaming services, including various transcoding technologies.
Workflow
Simple Workflow Service (SWF) | Logic Apps
Serverless technology for connecting apps, data and devices anywhere, whether on-premises or in the cloud for large ecosystems of SaaS and cloud-based connectors.
Hybrid
Outposts | Azure Stack
Azure Stack is a hybrid cloud platform that enables you to run Azure services in your company’s or service provider’s datacenter. As a developer, you can build apps on Azure Stack. You can then deploy them to either Azure Stack or Azure, or you can build truly hybrid apps that take advantage of connectivity between an Azure Stack cloud and Azure.
How does a business decide between Microsoft Azure or AWS?
Basically, it all comes down to what your organizational needs are and if there’s a particular area that’s especially important to your business (ex. serverless, or integration with Microsoft applications).
Some of the main things it comes down to is compute options, pricing, and purchasing options.
Here’s a brief comparison of the compute option features across cloud providers:
Here’s an example of a few instances’ costs (all are Linux OS):
Each provider offers a variety of options to lower costs from the listed On-Demand prices. These can fall under reservations, spot and preemptible instances and contracts.
Both AWS and Azure offer a way for customers to purchase compute capacity in advance in exchange for a discount: AWS Reserved Instances and Azure Reserved Virtual Machine Instances. There are a few interesting variations between the instances across the cloud providers which could affect which is more appealing to a business.
Another discounting mechanism is the idea of spot instances in AWS and low-priority VMs in Azure. These options allow users to purchase unused capacity for a steep discount.
With AWS and Azure, enterprise contracts are available. These are typically aimed at enterprise customers, and encourage large companies to commit to specific levels of usage and spend in exchange for an across-the-board discount – for example, AWS EDPs and Azure Enterprise Agreements.
You can read more about the differences between AWS and Azure to help decide which your business should use in this blog post
Source: AWS to Azure services comparison – Azure Architecture
Active Hydrating Toner, Anti-Aging Replenishing Advanced Face Moisturizer, with Vitamins A, C, E & Natural Botanicals to Promote Skin Balance & Collagen Production, 6.7 Fl Oz


Age Defying 0.3% Retinol Serum, Anti-Aging Dark Spot Remover for Face, Fine Lines & Wrinkle Pore Minimizer, with Vitamin E & Natural Botanicals


Firming Moisturizer, Advanced Hydrating Facial Replenishing Cream, with Hyaluronic Acid, Resveratrol & Natural Botanicals to Restore Skin's Strength, Radiance, and Resilience, 1.75 Oz

Skin Stem Cell Serum


Smartphone 101 - Pick a smartphone for me - android or iOS - Apple iPhone or Samsung Galaxy or Huawei or Xaomi or Google Pixel
Can AI Really Predict Lottery Results? We Asked an Expert.


Djamgatech

Read Photos and PDFs Aloud for me iOS
Read Photos and PDFs Aloud for me android
Read Photos and PDFs Aloud For me Windows 10/11
Read Photos and PDFs Aloud For Amazon
Get 20% off Google Workspace (Google Meet) Business Plan (AMERICAS): M9HNXHX3WC9H7YE (Email us for more)
Get 20% off Google Google Workspace (Google Meet) Standard Plan with the following codes: 96DRHDRA9J7GTN6(Email us for more)


FREE 10000+ Quiz Trivia and and Brain Teasers for All Topics including Cloud Computing, General Knowledge, History, Television, Music, Art, Science, Movies, Films, US History, Soccer Football, World Cup, Data Science, Machine Learning, Geography, etc....
List of Freely available programming books - What is the single most influential book every Programmers should read
- Bjarne Stroustrup - The C++ Programming Language
- Brian W. Kernighan, Rob Pike - The Practice of Programming
- Donald Knuth - The Art of Computer Programming
- Ellen Ullman - Close to the Machine
- Ellis Horowitz - Fundamentals of Computer Algorithms
- Eric Raymond - The Art of Unix Programming
- Gerald M. Weinberg - The Psychology of Computer Programming
- James Gosling - The Java Programming Language
- Joel Spolsky - The Best Software Writing I
- Keith Curtis - After the Software Wars
- Richard M. Stallman - Free Software, Free Society
- Richard P. Gabriel - Patterns of Software
- Richard P. Gabriel - Innovation Happens Elsewhere
- Code Complete (2nd edition) by Steve McConnell
- The Pragmatic Programmer
- Structure and Interpretation of Computer Programs
- The C Programming Language by Kernighan and Ritchie
- Introduction to Algorithms by Cormen, Leiserson, Rivest & Stein
- Design Patterns by the Gang of Four
- Refactoring: Improving the Design of Existing Code
- The Mythical Man Month
- The Art of Computer Programming by Donald Knuth
- Compilers: Principles, Techniques and Tools by Alfred V. Aho, Ravi Sethi and Jeffrey D. Ullman
- Gödel, Escher, Bach by Douglas Hofstadter
- Clean Code: A Handbook of Agile Software Craftsmanship by Robert C. Martin
- Effective C++
- More Effective C++
- CODE by Charles Petzold
- Programming Pearls by Jon Bentley
- Working Effectively with Legacy Code by Michael C. Feathers
- Peopleware by Demarco and Lister
- Coders at Work by Peter Seibel
- Surely You're Joking, Mr. Feynman!
- Effective Java 2nd edition
- Patterns of Enterprise Application Architecture by Martin Fowler
- The Little Schemer
- The Seasoned Schemer
- Why's (Poignant) Guide to Ruby
- The Inmates Are Running The Asylum: Why High Tech Products Drive Us Crazy and How to Restore the Sanity
- The Art of Unix Programming
- Test-Driven Development: By Example by Kent Beck
- Practices of an Agile Developer
- Don't Make Me Think
- Agile Software Development, Principles, Patterns, and Practices by Robert C. Martin
- Domain Driven Designs by Eric Evans
- The Design of Everyday Things by Donald Norman
- Modern C++ Design by Andrei Alexandrescu
- Best Software Writing I by Joel Spolsky
- The Practice of Programming by Kernighan and Pike
- Pragmatic Thinking and Learning: Refactor Your Wetware by Andy Hunt
- Software Estimation: Demystifying the Black Art by Steve McConnel
- The Passionate Programmer (My Job Went To India) by Chad Fowler
- Hackers: Heroes of the Computer Revolution
- Algorithms + Data Structures = Programs
- Writing Solid Code
- JavaScript - The Good Parts
- Getting Real by 37 Signals
- Foundations of Programming by Karl Seguin
- Computer Graphics: Principles and Practice in C (2nd Edition)
- Thinking in Java by Bruce Eckel
- The Elements of Computing Systems
- Refactoring to Patterns by Joshua Kerievsky
- Modern Operating Systems by Andrew S. Tanenbaum
- The Annotated Turing
- Things That Make Us Smart by Donald Norman
- The Timeless Way of Building by Christopher Alexander
- The Deadline: A Novel About Project Management by Tom DeMarco
- The C++ Programming Language (3rd edition) by Stroustrup
- Patterns of Enterprise Application Architecture
- Computer Systems - A Programmer's Perspective
- Agile Principles, Patterns, and Practices in C# by Robert C. Martin
- Growing Object-Oriented Software, Guided by Tests
- Framework Design Guidelines by Brad Abrams
- Object Thinking by Dr. David West
- Advanced Programming in the UNIX Environment by W. Richard Stevens
- Hackers and Painters: Big Ideas from the Computer Age
- The Soul of a New Machine by Tracy Kidder
- CLR via C# by Jeffrey Richter
- The Timeless Way of Building by Christopher Alexander
- Design Patterns in C# by Steve Metsker
- Alice in Wonderland by Lewis Carol
- Zen and the Art of Motorcycle Maintenance by Robert M. Pirsig
- About Face - The Essentials of Interaction Design
- Here Comes Everybody: The Power of Organizing Without Organizations by Clay Shirky
- The Tao of Programming
- Computational Beauty of Nature
- Writing Solid Code by Steve Maguire
- Philip and Alex's Guide to Web Publishing
- Object-Oriented Analysis and Design with Applications by Grady Booch
- Effective Java by Joshua Bloch
- Computability by N. J. Cutland
- Masterminds of Programming
- The Tao Te Ching
- The Productive Programmer
- The Art of Deception by Kevin Mitnick
- The Career Programmer: Guerilla Tactics for an Imperfect World by Christopher Duncan
- Paradigms of Artificial Intelligence Programming: Case studies in Common Lisp
- Masters of Doom
- Pragmatic Unit Testing in C# with NUnit by Andy Hunt and Dave Thomas with Matt Hargett
- How To Solve It by George Polya
- The Alchemist by Paulo Coelho
- Smalltalk-80: The Language and its Implementation
- Writing Secure Code (2nd Edition) by Michael Howard
- Introduction to Functional Programming by Philip Wadler and Richard Bird
- No Bugs! by David Thielen
- Rework by Jason Freid and DHH
- JUnit in Action
#BlackOwned #BlackEntrepreneurs #BlackBuniness #AWSCertified #AWSCloudPractitioner #AWSCertification #AWSCLFC02 #CloudComputing #AWSStudyGuide #AWSTraining #AWSCareer #AWSExamPrep #AWSCommunity #AWSEducation #AWSBasics #AWSCertified #AWSMachineLearning #AWSCertification #AWSSpecialty #MachineLearning #AWSStudyGuide #CloudComputing #DataScience #AWSCertified #AWSSolutionsArchitect #AWSArchitectAssociate #AWSCertification #AWSStudyGuide #CloudComputing #AWSArchitecture #AWSTraining #AWSCareer #AWSExamPrep #AWSCommunity #AWSEducation #AzureFundamentals #AZ900 #MicrosoftAzure #ITCertification #CertificationPrep #StudyMaterials #TechLearning #MicrosoftCertified #AzureCertification #TechBooks
Top 1000 Canada Quiz and trivia: CANADA CITIZENSHIP TEST- HISTORY - GEOGRAPHY - GOVERNMENT- CULTURE - PEOPLE - LANGUAGES - TRAVEL - WILDLIFE - HOCKEY - TOURISM - SCENERIES - ARTS - DATA VISUALIZATION

Top 1000 Africa Quiz and trivia: HISTORY - GEOGRAPHY - WILDLIFE - CULTURE - PEOPLE - LANGUAGES - TRAVEL - TOURISM - SCENERIES - ARTS - DATA VISUALIZATION
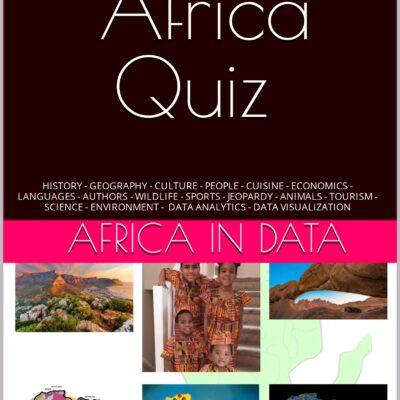
Exploring the Pros and Cons of Visiting All Provinces and Territories in Canada.


Exploring the Advantages and Disadvantages of Visiting All 50 States in the USA

Health Health, a science-based community to discuss health news and the coronavirus (COVID-19) pandemic
- Why Idaho’s hospitals are having pregnant patients airlifted out of stateby /u/nbcnews on April 25, 2024 at 3:41 pm
submitted by /u/nbcnews [link] [comments]
- What do weight loss drugs mean for a diet industry built on eating less and exercising more?by /u/Maxcactus on April 25, 2024 at 3:23 pm
submitted by /u/Maxcactus [link] [comments]
- Nestlé destroys two million bottles of Perrier over bacterial contaminationby /u/Sariel007 on April 25, 2024 at 2:09 pm
submitted by /u/Sariel007 [link] [comments]
- U.S. birth rate drops to record low, ending pandemic uptickby /u/CBSnews on April 25, 2024 at 1:34 pm
submitted by /u/CBSnews [link] [comments]
- Genomic surveillance could prevent the next pandemic, experts sayby /u/euronews-english on April 25, 2024 at 12:31 pm
submitted by /u/euronews-english [link] [comments]
Today I Learned (TIL) You learn something new every day; what did you learn today? Submit interesting and specific facts about something that you just found out here.
- TIL Semen can trigger anaphylactic allergic reactions in some people if their partner had recently eaten the allergen foodby /u/StolenViolentAnts on April 25, 2024 at 3:24 pm
submitted by /u/StolenViolentAnts [link] [comments]
- TIL about US Navy gunner Loyce Deen. Killed while flying, his body was too mangled to remove from the Avenger torpedo bomber he was in. The ship's crew covered the body and buried Deen at sea, using the Avenger as his coffin. It's the only known burial at sea involving an aircraft as tomb.by /u/MrMojoFomo on April 25, 2024 at 3:20 pm
submitted by /u/MrMojoFomo [link] [comments]
- TIL that originally Pixar made computers and made 3D animations to show how powerful their computers were. People liked the cartoons so much they later became an entertainment companyby /u/SoullessMemenist on April 25, 2024 at 2:45 pm
submitted by /u/SoullessMemenist [link] [comments]
- TIL of Benford's Law, which states that almost 50% of numbers in real-life datasets start with 1 or 2. This can be used to detect tax fraud.by /u/MyKinkyCountess on April 25, 2024 at 1:52 pm
submitted by /u/MyKinkyCountess [link] [comments]
- TIL that the same man, William A. Mitchell, invented Tang, Cool Whip, and Pop Rocks.by /u/BenjaminGeiger on April 25, 2024 at 1:29 pm
submitted by /u/BenjaminGeiger [link] [comments]
Reddit Science This community is a place to share and discuss new scientific research. Read about the latest advances in astronomy, biology, medicine, physics, social science, and more. Find and submit new publications and popular science coverage of current research.
- The case against the "gay gene": researchers predict it's impossible to say anything meaningful about the influence of genetics on sexualityby /u/buffalorino on April 25, 2024 at 2:57 pm
submitted by /u/buffalorino [link] [comments]
- People who get “catch-up sleep” on weekends are less likely to have depressive symptoms | The association was notably stronger among men, individuals under the age of 65, and those who sleep fewer hours on weekdays.by /u/chrisdh79 on April 25, 2024 at 2:36 pm
submitted by /u/chrisdh79 [link] [comments]
- Antarctic sea-ice loss reduces breeding success of emperor penguins. 2022 and 2023 have been the worst years on record for breeding success, impacting between 20-30% of the penguin colonies.by /u/Creative_soja on April 25, 2024 at 1:43 pm
submitted by /u/Creative_soja [link] [comments]
- Maternal grandmothers' investment can improve the well-being of grandchildren who have faced adversities in life. The positive effects can last well into adulthood.by /u/universityofturku on April 25, 2024 at 1:30 pm
submitted by /u/universityofturku [link] [comments]
- People who take acid-reducing drugs may have a higher risk of migraine and other severe headache than people who do not take these medicationsby /u/giuliomagnifico on April 25, 2024 at 1:13 pm
submitted by /u/giuliomagnifico [link] [comments]
Reddit Sports Sports News and Highlights from the NFL, NBA, NHL, MLB, MLS, and leagues around the world.
- Adrian Newey: Red Bull design chief to leave teamby /u/Gym-for-ants on April 25, 2024 at 3:41 pm
submitted by /u/Gym-for-ants [link] [comments]
- Sharks fire coach David Quinn after NHL-worst 19-54-9 seasonby /u/Oldtimer_2 on April 25, 2024 at 1:19 pm
submitted by /u/Oldtimer_2 [link] [comments]
- Cain Velasquez's attempted murder trial set for Septemberby /u/Oldtimer_2 on April 25, 2024 at 1:02 pm
submitted by /u/Oldtimer_2 [link] [comments]
- Our NFL draft cheat sheet: Everything you need to know on top prospects, team needs, projectionsby /u/jefferymr15 on April 25, 2024 at 12:48 pm
submitted by /u/jefferymr15 [link] [comments]
- MLB Roundup: Gunnar Henderson leads Orioles to win over Angelsby /u/kundu123 on April 25, 2024 at 11:13 am
submitted by /u/kundu123 [link] [comments]